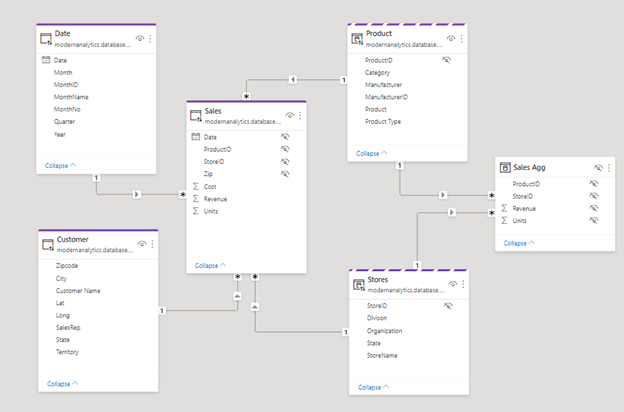
Aggregation (agg) tables are summary tables that allow you to speed up performance for large Power BI datasets in DirectQuery storage mode. For example, let’s say you have a transaction / fact type table where you have many different attribute columns. In the example data model below, that would include dimension tables like Date, Product, Customer, Stores, etc. The attributes from these dimension tables might be important for your data, but the end users consuming a specific report from this dataset may spend 95% of the time slicing on specific attributes like Product or Date.

By configuring an aggregation table(s), you allow Power BI to cache or save those aggregated defined results from your implicit measures. Then, when creating your visualizations and DAX calculations, the formula engine recognizes that relationship to an aggregation table and will use the user-defined aggregations feature in the formula engine instead of mapping to the original fact table.
Performance Difference Using Aggregation Tables
This can help with performance in a couple of ways. First is size: your fact table(s) may have upwards of hundreds of millions to billions of rows. This could be a storage constraint for those organizations only using Power BI Pro licensing. And depending on the data source performance, it should increase the speed of your DAX calculations that are funneled through your aggregation(agg) table(s).
So how does this work? First, bring all your tables in your Power BI dataset in as Direct Query storage mode. Make sure your agg tables are defined ahead of time. Next switch the storage mode from your related dimension type tables to dual storage mode. These tables should be related to both your original fact(s) and your agg table(s). After that, switch the storage mode of your agg table(s) to “Import”. Finally configure your agg table(s) in Power BI desktop.
How much faster? Many variables impact report generation speed. For example with a data source like a SQL database, adding indexes can improve speed and return time with a query whether there are aggregation tables or not. Other performance tuning options can variably change that query response time. However, in a demo we ran, we ran both types of report queries on the same database (that had no performance tuning). Using aggregation tables vs not using them delivered a significant difference for those specific data sets. It took 90 seconds to return the summarization of the entire fact table of over 10 million rows compared to less than a second for measures connected to our aggregation table.
When Should You Use Aggregation Tables?
Let’s look at two scenarios where aggregation tables may be useful for you in your report and data model design.
Scenario One: Faster Results
In the first scenario, we need a Power BI report that is in DirectQuery. That’s a business requirement. We need data that’s near real-time, but we also need our calculations to run faster. With that DirectQuery connection I’m not getting the results returned fast enough for end user satisfaction.
Scenario Two: Memory Limits
In the second scenario, the Power BI report is in import storage mode and the file is too large to publish online. This scenario applies to organizations that are using Power BI Pro licensing where you have a memory limit of 1 gigabyte for a Power BI Desktop file. For those using Power BI Premium, scenario two doesn’t apply. With Premium, you can upload files up to 100 gigabytes and use the large file storage format enabled through Power BI Premium.
Aggregation Table Setup Tips
We’ve looked at when and why to use aggregation tables. In this section, I’m going to cover some tips and guidelines for the setup of this feature.
All Table Queries Should be Brought in as DirectQuery Storage Mode
Initially in your data model, you’ll want to bring in all your table queries as DirectQuery storage mode. If you initially bring them in as Import, then you will have to delete all your queries and re-load them as DirectQuery to make the switch. You can’t dynamically go from Import to DirectQuery, (or Dual as another option). If you start with DirectQuery you can always change it to either Dual or Import from there, but you can’t go the reverse direction.
Pre-Define Aggregation Tables
An aggregation table needs to be defined ahead of time. That is, you need to have some type of aggregated source object defined before bringing it into Power BI desktop. Calculated tables in DAX are not allowed in your agg table setup.
Configure Storage Modes
You will need to change the storage modes of your DirectQuery tables to Dual and Import. In the data model example below, starting from left to right, you can see by the solid line at the top that the first three tables (Date, Customer, and Sales) are all still in DirectQuery mode. Continuing to the right, our Product and Stores tables are in dual mode and have a dotted line over the top. Finally, our agg table on the right is in import mode, which removes that colored line at the top. Note that Product and Stores are linked to both the original fact/transaction table (Sales) and the agg table.
Configure Aggregation Table
You will also want to configure your aggregation table in your data model. You can see an example of this below with the Product ID and Store ID, and with Revenue and Units as your measures.
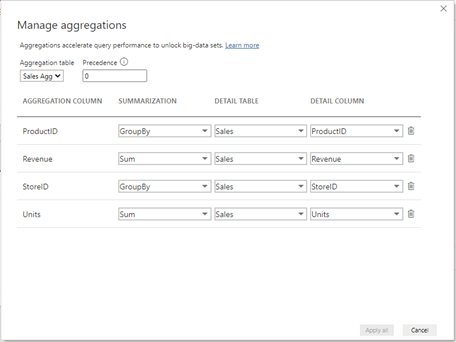
You also want to indicate which attributes you want to group by, and which measures you want to aggregate by. In this example, we aggregate Revenue and Units as a sum. For our attributes of Product ID and Store ID, we select group by so we can use them in slicers and on our axes in our visualizations.
Other aggregate functions are count (distinctcount), count table rows (countrows), max, and min.
Performance Results
After configuring our aggregation table in our data model, we can now test our query results. Theoretically, columns connected to our aggregation table should return much quicker than those columns that are not connected.
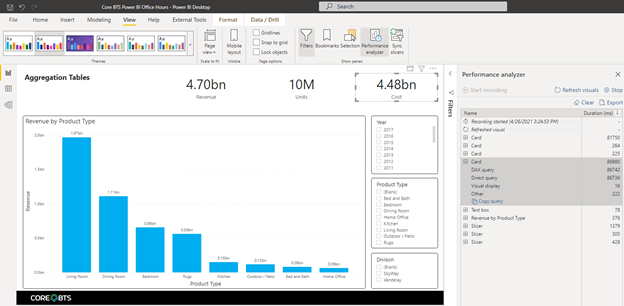
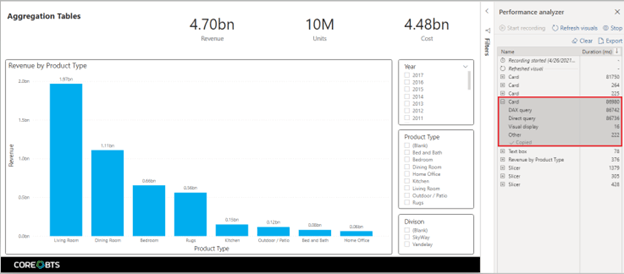
First, we created a simple report page seen below. We opened the Performance Analyzer pane and recorded our query times.
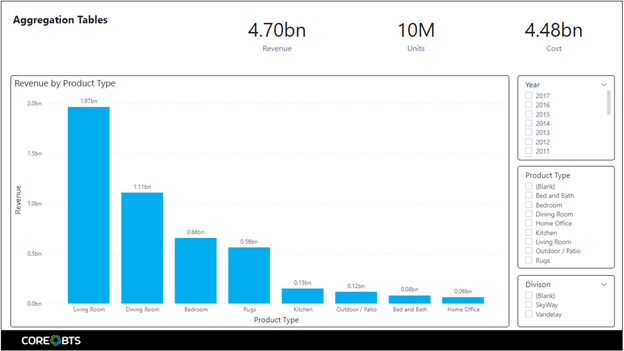
You can see that our visuals return nearly all under a second except our card visual containing a summarization of our cost column. This should not be a surprise as the “Cost” column was not included in our aggregation table setup above.
To confirm if your DAX query is using the aggregation table in its query plan you can hop over to DAX studio. You can launch this tool from the external tools menu, if you have that configured, or open it separately and connect to your open Power BI desktop file.
Next, we will copy the card query summarizing cost and paste it into our DAX studio query window. We’ll enable the server timings setting and evaluate the query.
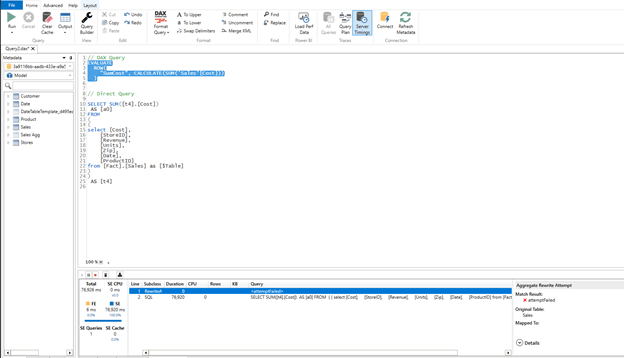
We can see that our rewrite attempt failed and that the query took almost 80 seconds to return.
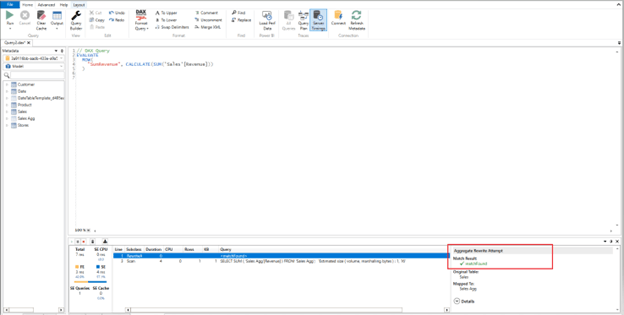
Next, we will show the query that’s connected to the aggregation table with our card summarizing revenue.
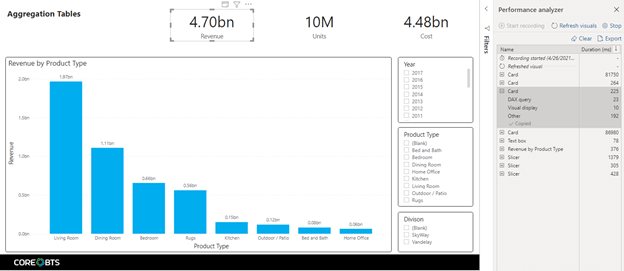
This time around, our query for revenue returns in less than a second. And – sure enough – a match to the aggregation table has been found in the query plan!
Conclusion
We hope this dive into aggregation tables has helped you decide when to use them to optimize your data model and query performance, along with answering some basic questions about the configuration of aggregation tables.
For more assistance with aggregation tables, or other Power BI data management needs, review our past blogs, reach out to the Core data team.