While Power BI is sometimes thought of as a front-end visualization tool, with it Microsoft created a “kitchen sink” Business Intelligence system that includes all the standard parts of a traditional solution. Here is a high-level view of Power BI and a look at the “ETL” part that is hidden behind the External Data Section. (By the way, that part is the same subsystem as in Power Query in Excel; it has been transplanted to SSAS 2017 and newer Tabular Models as well as Dataflows in Azure Data Lake.)
What is Power BI doing?
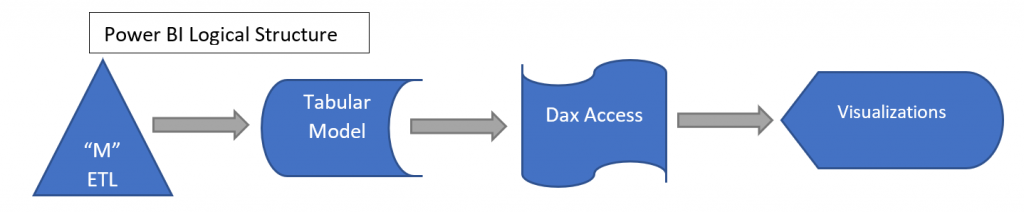
Power BI can be decomposed into standard Business Intelligence functional areas. You have an ETL (Extract, Transform, Load) Tool in the External Data Query section, Modeling in the Relationships area, Data Access language with DAX and its measure creation, and visualizations. In fact, we have seen usage exactly this way as Power BI’s usage spreads. Many people are using Power BI as a high horsepower version of what many small businesses did with Excel.
It’s good that Power BI can be looked at in the general Business Intelligence framework because you can use these reports as a basis to create a more traditional solution – a large, more scalable and supportable BI system that can be expanded and efficiently managed.
But there’s also some bad in that it is easy to use for individual functional tasks by different people because it encourages compartmentalization (Siloed Data Marts have their perfect tool here). When many people in a business independently use Power BI, the models won’t mesh (they won’t, no matter what!), and there will be issues with data and support as usage grows. These are normal issues when a tool like Power BI is adopted by more and more people in a business.
Looking at Power BI in this way helps the BI Professional realize that all the stuff they learned over the years can be applied to Power BI – to compose with and to decompose when the Power BI structure needs to be re-engineered for a bigger environment (ex. – SSAS back-ends over a Datamart in SQL Server). The best practices developed over the past 20 years can be used to expand Power BI systems to handle more enterprise tasks!
External Data and the “M” mashup language
With that background in mind, let’s focus on the ETL part of Power BI: The Query Manager and the underlying Power Query M language. How it should be used? What can it do to clean up data? What are signs that point to a more engineered solution?
Like many popular ETL tools, the Power Query language is wrapped in a front end so (for many cases) the user doesn’t know there is an underlying language. The language underneath the “External Data” part of Power BI is a lot easier to understand than, for example, the SSIS package format. M is a kind of functional language that at first looks somewhat exotic but is relatively easy to work with based on the code that is generated. There are several decent introductions to M and how to use it (see the references at the end, especially the book by Gil Raviv). Using Power Query Editor and M are taken to be the same thing – you can go back and forth.
Loading (the L in E-T-L)
M has a very simple load capability. For Excel, Power BI and SSAS, it loads into a Tabular structure. This limits the usability of this tool in those contexts. There are methods to extract the data, but not in a robust solution. If one is using Azure Data Lake, then one can use the Power Query to create outputs that can be used by further dataflow tools. This is new but shows two things: that Microsoft is committed to Power Query’s use in more places, and that there is a path forward for Power Query as a more general purpose ETL tool.
Since Analysis Services also has this tool as of the latest 2017 SQL Server, one can design a Tabular Model in SSAS using the capabilities of M and then connect to that either live or with a query from multiple Power BI documents. This design is more scalable. It is one step further along the road to a full data mart style backend and is a welcome addition by Microsoft.
A limitation in the past for Power BI was that (except for live connections to SSAS) all the data needed to be loaded every time it was refreshed. There is a new feature in Premium Power BI (May 2018) that allows incremental loading of, say, only the last 5 days, but it is only available in the Azure Power BI service. Whenever you republish (ex – after having changed a visualization), you would need to reload everything. While that opens some possibilities, it is still limited in terms of design. Lengthy, or often broken loads, are an indicator that some re-design needs to be done.
Extracting (the E in E-T-L)
This is where M shines. It is the most powerful extraction tool Microsoft makes available in terms of the combination of ease of use and types of data accessible. The release in Azure Data Lake Dataflows gives hope that a general standalone version may be possible.
The list of sources for Power BI is constantly growing and has more than 60 as of mid-2018.
Some included categories are:
- Web Scraping
- APIs like Google Analytics, Salesforce, and many more
- SQL databases
- Applications like Exchange, VSTS, and Entra ID
- SharePoint Lists
- Web feeds like OData
- Spark and Hadoop HDFS
- R Scripts
- Self-generated Data (for example, a Date Dimension)
- …and many other types
Ultimately, what each of the sources provide is a dataset of columns and rows. The load process will assign types to them which may be changed later. Once we have one or more of these datasets, then we can transform them.
Transformations (the T in E-T-L)
This is a powerful set of capabilities. M can do the following:
- Clean data
- Remove columns and rows
- Reshape by unpivoting or pivoting
- Change data types
- Bucket data
- Impute data
- Join queries with outer or natural joins
- Call learning models to classify
- …and more
When you read recommendations to not create calculated columns in Power BI, they are saying that in terms of DAX. However, you should create columns using M as necessary to clean data, transform it to useful values, narrow it and more.
As a guideline, anything that is not dependent on context (where it should be a measure), or a prototype, or a personal document should not be in DAX. Push what you can back in the load process.
M is very workflow-oriented. You can see the “steps” in the “Applied Steps” when working in the Power Query Editor. These correspond directly with M function calls. They are visible in the “formula bar”. The whole M script for a query can be seen by right clicking the query and picking the “Advanced Editor”. In another post we will take an example and look at what we can do using M.
Power Query and M are very powerful together
The more power you use, the more you should consider if the logic should be centralized in Analysis Services or SQL. If a lot of people are copying data into Power BI workbooks separately, then sooner or later they won’t match when used in visualizations. This is when it is time to talk to professionals!
If your BI team doesn’t have data modeling skills, our data consultants can help model your data appropriately. They can also create reliable processes around load performance, data governance, and archiving. Then the users can argue about what a number means for a business process rather than how it is defined.
Fortunately, Power BI allows that design to be done at a higher level and with less changes to the front-end.
Links about Power Query M related to this article:
- Gil Raviv’s book on Power Query. Current and useful – a combination of using the Power Query interface plus dipping into M language as necessary
- Description of how M is integrated into 2017+ SSAS Analysis Services Tabular Models.
- A good general introduction to M in the (free)Webinar referenced in this article.
- How to use R in Query Editor in Power BI. This is a way to a hack to extract data from Power BI.