If you’re involved in eliciting, modeling, analyzing, or consuming requirements for Business Intelligence (BI) projects, then this post is for you. Metrics and KPIs are among the primary techniques for anything related to Business Intelligence. If you can measure it, you can report on it. The “key” is picking the right metrics and KPIs.
What Are Metrics and KPIs?
The official definition of this technique, according the International Institute of Business Analysis (IIBA®) is: “Metrics and key performance indicators measure the performance of solutions, solution components, and other matters of interest to stakeholders.” – BABOK® v3.0
Some further definitions include:
Metric: quantifiable levels to measure progress
Indicator: numerical measurement representing degree of progress toward:
- Goal
- Objective
- Output
- Activity
- Further Output
KPI: metric used for strategic purposes
What Are the Elements of Metrics and KPIs?
Indicators:
- Clear
- Relevant
- Economical
- Adequate
- Quantifiable
- Trustworthy / Credible
Metrics: quantifiable
Structure:
- Reliable
- Valid
- Timely
Reporting: visual output
How Are Metrics and Key Performance Indicators Used?
- To compare baseline metrics against current ones, to target difference in both relative and absolute terms
- To identify credible trends
- To visually and effectively represent and explain data
- To inform business decisions
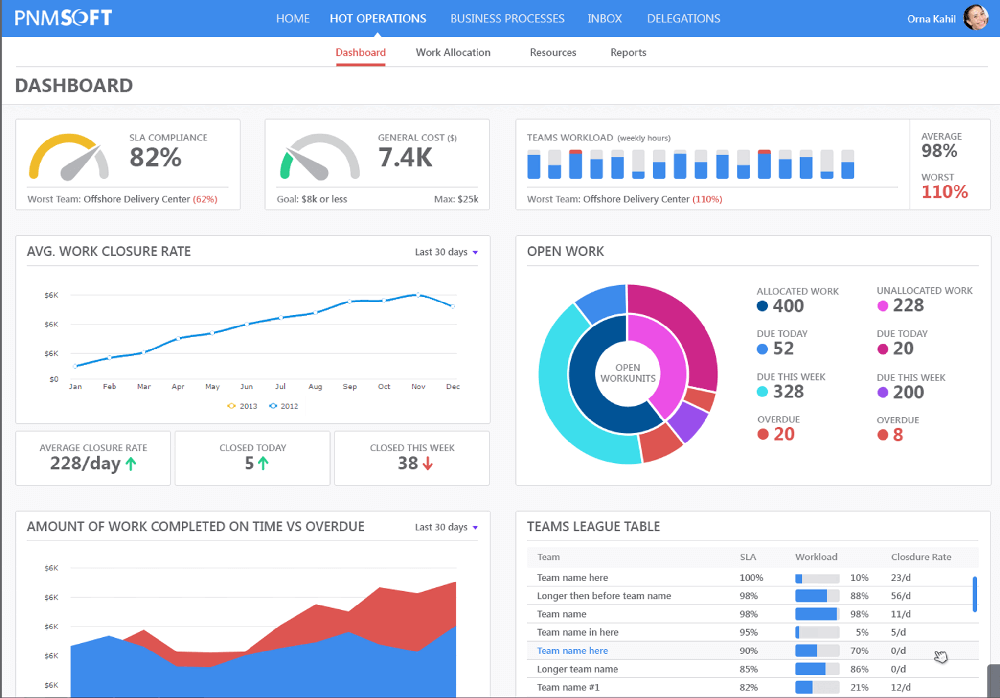
Example from: http://www.pnmsoft.com/resources/bpm-tutorial/key-performance-indicators/
Pros
Having good intelligence about a business or organization helps the organization run. It helps leaders identify trends so they can predict what might happen in the future. It helps companies improve their performance and manage their operations. Being able to get meaningful visuals based on accurate data can dramatically help companies make better business decisions.
Cons
You must trust the integrity of the data that drives your metrics and KPIs. If you have dirty data, you’ll have dirty results.
Getting data in the right place and properly related is a difficult job. Users of the data must also understand these relationships, or they could possibly misuse or misreport on something. Your data users need to be knowledgeable about what the data means.
Once you start measuring something, you start influencing people’s behavior. This is something you need to be aware of because it is human nature to start to “game the system”.
Operational and transactional data is about things that have already happened, and you can’t change history. However, you can use these numbers to anticipate the future so you can make informed plans based on insights you glean from the data.
Conclusion
Metrics and KPIs are important for most organizations to help them optimize and improve their business operations and make better business decisions. For it to work, though, the underlying data must have integrity and be trusted.
References:
“IIBA Home.” IIBA | International Institute of Business Analysis, www.iiba.org/.
“PMI.” PMI | Project Management Institute, www.pmi.org/.