Background
Before diving into the Google Analytics connector for Power BI and its challenges, I first want to provide a bit of background on dataset granularity. For those familiar with building a BI solution, you’ll agree that loading detailed data into a data model provides the most flexibility in reporting and data analysis.
For those not familiar, here is a very simplistic example:
Let’s say we want to report on consumer sales. For each customer transaction, we could load the total purchase amount into our data model. This would give us the ability to report sales by customer and date. What about product? We loaded one record per transaction, but a transaction may contain multiple products. By only pulling transaction total, we lose the ability to analyze sales related to products.
A better approach is to load the transaction line items into the data model. We can still get the total purchase amount for customers and dates by aggregating the line items, and we can now also view sales by products. Now, this may seem obvious, and you may question why I point this out. That will become clear as we cover the challenges below. (See our Data & Analytics solutions)
Google Analytics Connector for Power BI
The Google Analytics connector for Power BI allows you to build a Power BI dataset consuming data from your Google Analytics solution. The connector utilizes the Google Analytics Core Reporting API to import data into the Power BI tabular model. This means it isn’t a live connection to Google Analytics.
What’s interesting about the Google Analytics API is that it acts much like a cube when querying the data. We get the data at the granularity we request. To demonstrate this, let’s look at a model that queries for Sessions and Pageviews. We start by pulling only those two metrics and nothing else. We get a single row of data containing the total sessions and pageviews across all dimensions.
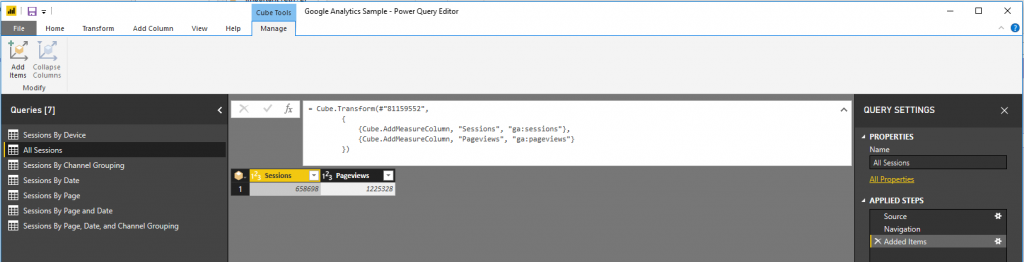
Figure 1a. Power Query showing data for Sessions and Pageviews
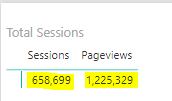
Figure 1b. Power BI report table showing the values pulled from the Power BI Model
A key point to make here is that data is pulled from Google Analytics into the Power BI model when the report is initially built, and when the model is periodically refreshed. When data is displayed on the report pane in Power BI, the report is displaying the data from the Power BI model, and NOT directly from Google Analytics.
As mentioned above, the connector is not a live connection to Google Analytics. Even though the Google Analytics API acts like a cube, once the data is pulled into the Power BI model, we no longer leverage Google Analytics’ cube behavior. Instead, we will utilize Power BI’s tabular model behavior.
Let’s update the query to include Channel Grouping. You’ll notice that we now get a row with the session and pageview counts for each channel grouping. You’ll also notice that the total values for sessions and pageviews across all channel groupings match the values we saw above as shown in Figures 1b and 2b. Hopefully, the points on data granularity above are starting to become clear.
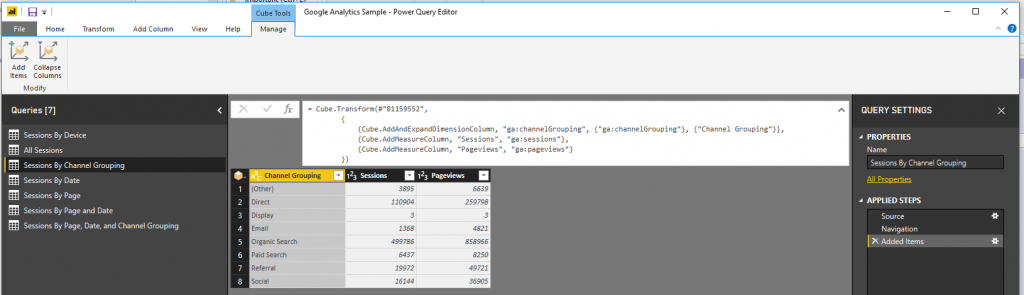
Figure 2a. Power Query showing data for Sessions and Pageviews by Channel Grouping
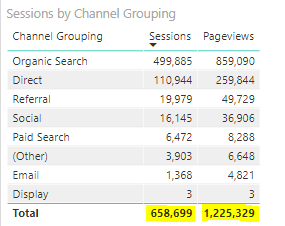
Figure 2b. Power BI table showing the Session and Pageview values by Channel Grouping
We see this same behavior when including Date or Page instead of Channel Grouping (as shown in Figures 3a. and 3b.). This is what we would expect and desire. (In reality, this is only expected for the pageviews value. We’ll discuss the sessions in Challenge 2 below).
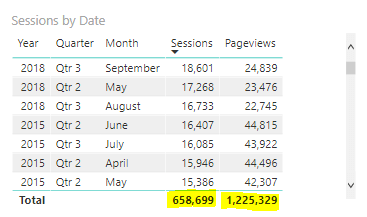
Figure 3a. Power BI table showing Session and Pageview values by Date
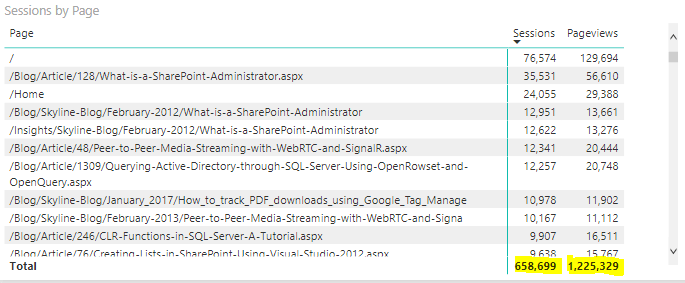
Figure 3b. Power BI table showing Session and Pageview values by Page
Recap
Let’s summarize what we’ve covered before moving on to the challenges:
- Ideally, we pull data at the lowest granularity. This provides the most flexibility in reporting and analysis.
- The Google Analytics connector returns data at the granularity that we request.
- If we query sessions and pageviews by date, page, or channel grouping, the totals match and we get the data we expect.
- If we want the flexibility of analyzing our Google Analytics data by date, time of day, page, channel grouping, mobile device, among others, then…:
- We would include all these attributes in a single query when pulling sessions and pageviews.
- We would expect one record per unique combination of these values, and we would expect the grand total of all records to match the single total when pulled on its own.
Challenge 1
As covered in the recap, ideally, we pull the sessions and pageviews, and all the dimension slicers in a single query. However, the Google Analytics API does not give us the desired results. To demonstrate this, we’ll first look at mobile device on its own. When pulling sessions and pageviews by mobile device info, we get much less data than we would expect (as seen in Figure 4b). In this case, it appears that we only get sessions and pageviews that originated from a mobile device. We lose all other sessions. We would prefer that the API still return these session and pageview counts with a “Not Applicable” mobile device Info.
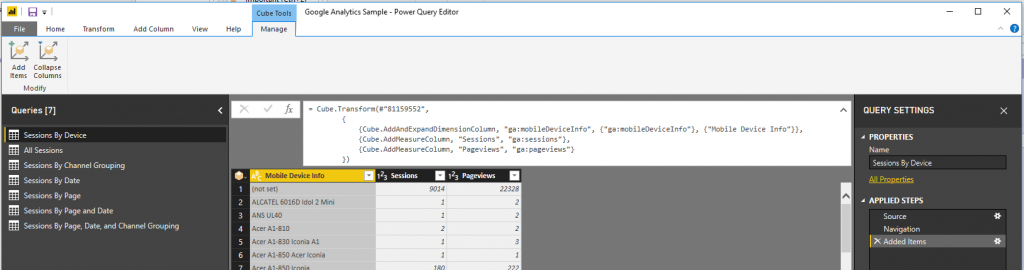
Figure 4a. Power Query showing data for Sessions and Pageviews by Mobile Device
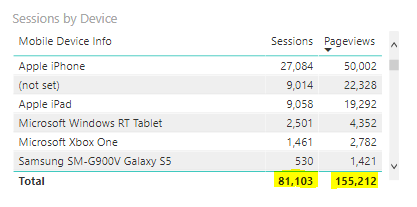
Figure 4b. Power BI table showing Session and Pageview values by Mobile Device
We see similar behavior when including Page, Date, and Channel Grouping in the same query. These returned the expected total in the individual queries but is missing data when combined (see figure 5b). Though we have a theory of why that happens for mobile device, it’s unclear why this happens when combining page, date, and channel grouping.
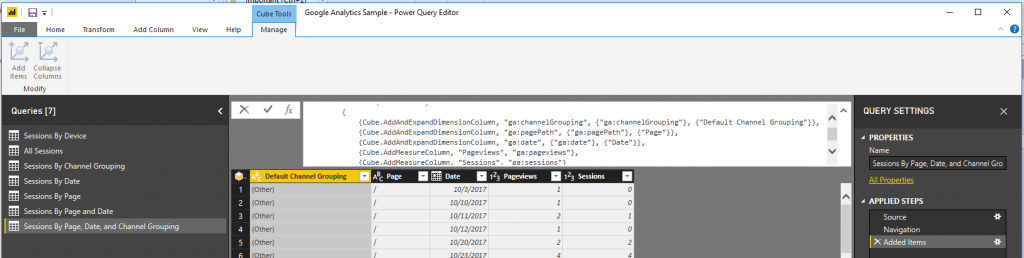
Figure 5a. Power Query showing data for Sessions and Pageviews by Channel Grouping, Page, and Date
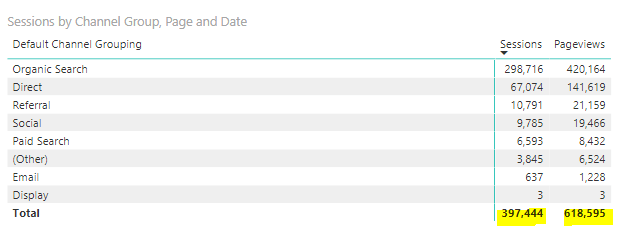
Figure 5b. Power BI table showing Session and Pageview values by Channel Grouping, Page, and Date
Challenge 2
You may also be thinking about the sessions by page value. Since a user’s session will often contain more than one pageview, when we sum the sessions by page values, we would expect the total to be higher than the single total sessions value when pulled on its own. That’s not the case as we saw the values in figures 2 and 3 match figure 1.
Let’s think about a hypothetical single user session.
In that session, the user visited Page A once, and Page B twice. Figure 6 shows the expected and actual results of those queries. The Google Analytics API is only counting one of the pageviews toward the session count. This does allow the total session value to be correct when summing across all pages but prevents analyzing sessions at the page level. We can see this in Figure 5a. Some pages have a pageview count greater than 0, but a session count = 0. This is not intuitive since every single page view should belong to a session. Viewing sessions by page is not a meaningful metric and should be avoided since only one page is related to a session.
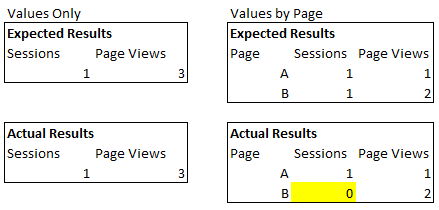
Figure 6. Expected and actual query results of hypothetical single user session
Solution
Due to the challenges above, we lose the ability to create a single fact table in our model containing sessions, pageviews, and relationships to all the dimensions in which we want to summarize this data. Instead, we will need to create multiple fact tables, each containing a subset of the dimensions that play nicely together.
If we need to see pageviews by non-mobile devices, a measure will need to be created that subtracts mobile device pageviews from total pageviews. Though these challenges will make the model more complex, and we lose the ability to slice and dice the session and pageview counts in any way imaginable, this approach will support many of the common reporting and analysis scenarios that are desired.
Conclusion
It is important to understand the complexities and challenges with the way the Google Analytics Connector for Power BI returns data. With a little creativity and a few compromises, these challenges can be overcome, and this can be a great way to incorporate your Google Analytics data into your company’s Power BI Analytics solution. I’ve shown just two of the complexities that you may encounter.