Often when we think about referential integrity (RI) we think of relational databases or data warehouses. While we should have referential integrity constraints in those systems, it may not always be implemented for various reasons. When building a tabular model, we should also be concerned about RI, and we should not assume that the source data has referential integrity between tables. This is especially true if combining data from multiple data sources. An example of an RI issue is if you have sales in your sales table that refer to a customer with a key of 123 and you don’t have a customer with a key of 123 in your customer table. Who do those sales belong to? The model can’t answer that.
How can you determine if there are referential integrity issues in your tabular model? That is the question I plan to answer. I will walk you through how to detect if there are issues, which tables they reside in and which values in each table are the problem.
First, we need a little background on how tabular models handle RI issues. In the example above where there is a missing Customer, the tabular model generates a blank row in the customer table. Any table on the Many side of the relationship that references a customer that does not exist, including customer 123, will relate to the auto-generated blank row in the customer table. A blank row will also be generated if the customer key is blank. This behavior is standard to tabular models, and further explanation is outside the scope of this post.
Finding RI Issues – The Easy Way
There is a simple query you can run against your tabular model to find the tables with RI issues. However, the steps to find the rows in the tables that are causing issues can be manual, tedious and potentially error prone. These steps are listed below. To avoid running these steps manually, I created the Tabular RI Analyzer. It is a Power Pivot model that can help automate the process. It utilizes the Analysis Services Dynamic Management Views (DMV) and DAX.
To use it with your tabular model, you must point the connection of the internal Power Pivot model to your Analysis Services database and Refresh the data. There is an instructions worksheet in the workbook explaining how to do this. After refreshing the data from your tabular model, ensure the RI Violations Slicer is set to “Yes”. If “Yes” is not an option in the slicer, that means the tabular model doesn’t have any blank rows or RI issues. This model has been created with Excel 2013 and does require the Power Pivot Add-in. It may not work with versions of Excel prior to 2013.
The screenshot below shows the output when connected to a sample AdventureWorks tabular model. Every row in the table corresponds to a relationship in the model. After ensuring the RI Violations slicer has been set to “Yes”, the table displays a list of all the relationships that could be causing the RI issue. For each relationship in the list, it displays the One Side, the Many Side, whether the relationship is active and three DAX queries.
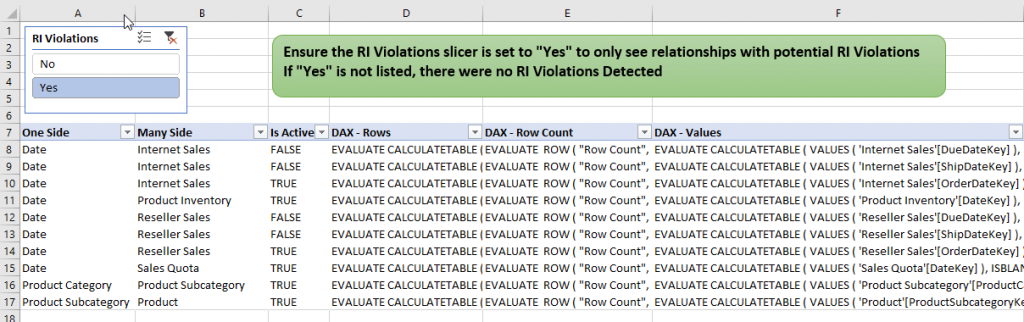
The DAX – Rows queries will return all the rows for the relationships that are causing the RI issue. In smaller models it may be easiest to start with these queries. The DAX – Values and DAX – Row Count queries can be used on larger models if you first want to understand either how many rows or the specific values that are causing the RI issues. These DAX queries can be copied directly into DAX Studio or Management Studio and run to see the results. You may prefer DAX Studio as you can run the complete list of DAX statements together and get all the result sets back at once.
Each reference or relationship of a table with the blank row must be checked since it can be any one of them that are causing the blank row to be generated. In the AdventureWorks example above, the Date table has a blank row. It could be caused by any one of the relationships to any one of the related fact tables. They must all be reviewed to see which one is causing the issue. Therefore, some of the DAX queries may not return results.
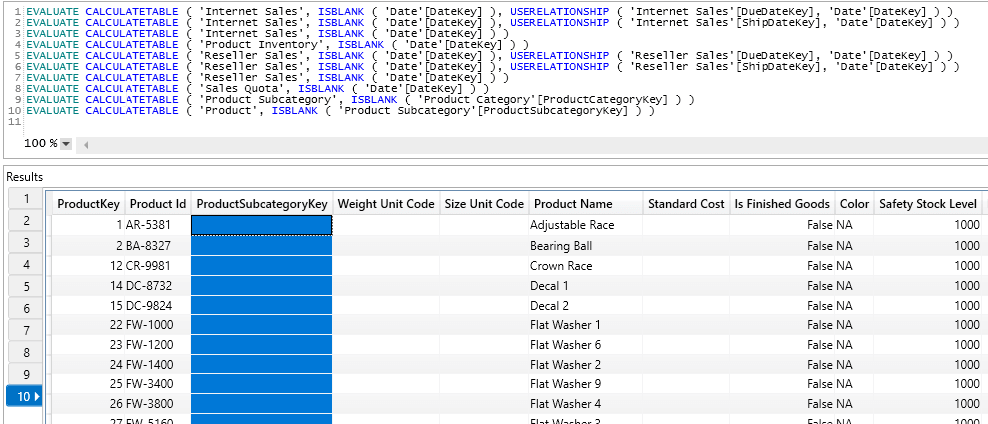
The following screenshot shows the 10 result sets returned from the 10 DAX – Rows queries. Only result set 8 (Sales Quota table), 9 (Product Subcategory table) and 10 (Product table) returned rows. I have highlighted some of the missing ProductSubcategoryKeys from the Product table which are causing the blank row to be generated in ProductSubcategory. For every table in the One Side column, there should be at least one query that returns the records causing the RI issue.
I encourage you to pause now to try the Tabular RI Analyzer for yourself. You can download the Excel workbook here. It will work with SQL Server Analysis Services, Power BI, and Power Pivot tabular models. Note that this is the first release, so please provide any feedback you may have.
Download Tabular RI Analyzer
If you are interested in the details on how this works, continue reading.
Detecting RI Issues Step-by-Step
Step 1 – Find the tables that have a blank row
To find the tables that have RI issues, you can query the SSAS DMV’s of the tabular model. There is not much documentation on DMV’s, but this technique does seem reliable. The other limitation with DMV queries for Analysis Services is that you cannot join multiple DMV’s together. This makes troubleshooting even more tedious, and it’s one of the problems the Tabular RI Analyzer helps solve. The query below will list the tables that have RI issues in a sample AdventureWorks database.
select DATABASE_NAME, TABLE_ID, ROWS_COUNT, RIVIOLATION_COUNT
from $SYSTEM.DISCOVER_STORAGE_TABLES WHERE RIViolation_Count > 0
The results from the query are listed in the screenshot below:
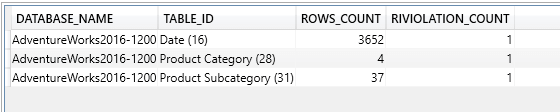
The RIVIOLATION_COUNT column will return the number of relationships or tables on the Many side that are causing the blank row to be generated.
A DAX query can then be written to confirm that a blank row does exist in a table. Now that we understand why blank rows are generated, we can search for them using a DAX query. The query below can be used to determine if a table in your model has a blank row.
EVALUATE
ROW ( “Table”, “Product Subcategory”, “Blank Rows”, COUNTROWS ( ALL ( ‘Product Subcategory’ ) ) – COUNTROWS ( ALLNOBLANKROW ( ‘Product Subcategory’ ) ) )
If this statement returns a 1 for the Blank Rows column, it confirms that the blank row does exist.
Now that we can determine the tables that have blank rows, it would be helpful to find the values in the Many side of the relationship to these tables that are causing the blank row to be generated. Since a table that has a blank row can have multiple tables that relate to it from the Many side, each one must be checked as one or more of the tables could be causing the blank row to be generated.
To continue with the example from above, Product Subcategory was determined to have a blank row. This means that the blank row was generated from the existence of a relationship between itself on the One Side and another table on the Many Side. There could be multiple tables on the Many Side. However, in this example, Product is the only one. Another common example of a table that has relationships to multiple tables on the Many Side would be a Date Table. A Date Table could be referenced by multiple fact tables in a typical dimensional model.
Let’s walk through the remaining steps to determine what caused the blank row to be generated in Product Subcategory.
Step 2 – Find the internal ID of the table
The first piece of information we need is the internal ID of the table in question. To find the internal ID we can again rely on another DMV query. For example, if we are looking to find the reason a blank row is being generated in the Product Subcategory table, the following query can be used:
select * from $SYSTEM.TMSCHEMA_TABLES Where [Name] = ‘Product Subcategory’

The ID for the Product Subcategory table is 31. This should also match the suffix of the TABLE_ID column from the first DMV query above.
Step 3 – Find the table/column combinations that relate to the ProductSubcategory table
In the queries that follow, you will see “To” and “From” as column prefixes. The table on the One side of the relationship is considered “To” and the Many side is considered “From”.
To find the related tables and columns, the following DMV can be run with the ID that was found using Step 1.
select [ToTableID], [ToColumnID], [FromTableID], [FromColumnID], [IsActive]
from $SYSTEM.TMSCHEMA_RELATIONSHIPS Where [ToTableID] = 31
order by FromTableID
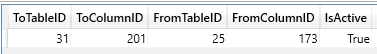
You can see that there was only one related table and the ID is 25 with a FromColumnID of 173. You can also note that this relationship is Active.
Step 4 – Get the names of the related tables and columns to write the DAX query in the next step
We know the name of the ToTable is Product Subcategory because that is what we started with. To get the names of the From table and both columns, you’ll need to run more DMV queries. You will need to use the FromTableID column from the prior query results as the where clause in the next query. The same will apply to both column ID’s as you can see in the queries below.
–Get the name of the FromTableID
select [ID], [Name] from $SYSTEM.TMSCHEMA_TABLES Where [ID] = 25

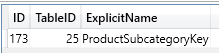
–Get the name corresponding to the FromColumnID – This will only be required when the relationship being reviewed is Inactive
select [ID], [TableID], [ExplicitName] from $SYSTEM.TMSCHEMA_COLUMNS where [id] = 173
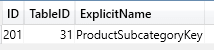
–Get the name corresponding to the ToColumnID
select [ID], [TableID], [ExplicitName] from $SYSTEM.TMSCHEMA_COLUMNS where [id] = 201
Step 5 – Create a DAX query to find the offending values
If the relationship being evaluated is for an Active relationship, use the following template replacing FROMTABLENAME, TOTABLENAME and TOCOLUMNNAME with the values found from above. Take note to not add the suffix ID as in the cause of “Product (25)”. Simply remove the suffix and use “Product”.
EVALUATE CALCULATETABLE ( ‘FROMTABLENAME’, ISBLANK ( ‘TOTABLENAME'[TOCOLUMNNAME] ) )
In this example, the DAX query would look as follows:
EVALUATE CALCULATETABLE ( VALUES ( ‘Product’ ), ISBLANK ( ‘Product Subcategory'[ProductSubcategoryKey] ) )
If the relationship being evaluated is for an Inactive relationship, use the following template:
EVALUATE CALCULATETABLE ( VALUES ( ‘FROMTABLENAME’ ), ISBLANK ( ‘TOTABLENAME'[TOCOLUMNNAME] ), USERELATIONSHIP ( ‘FROMTABLENAME'[FROMCOLUMNNAME], ‘TOTABLENAME'[TOCOLUMNNAME] ) )
If the relationship in the example above was Inactive, the DAX query would look as follows. Note that this DAX query will work the same as above with an Active relationship, however the use of USERELATIONSHIP is not required for an Active relationship.
EVALUATE CALCULATETABLE ( VALUES ( ‘Product’ ), ISBLANK ( ‘Product Subcategory'[ProductSubcategoryKey] ), USERELATIONSHIP ( ‘Product'[ProductSubcategoryKey], ‘Product Subcategory'[ProductSubcategoryKey] ) )
Step 6 – Run the DAX query
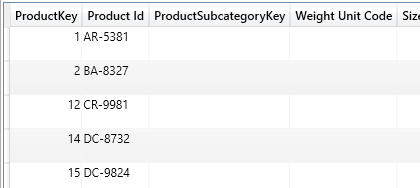
Run the DAX query to see which records in the Product table have values that are not associated to the Product Subcategory table or have blanks. It will always be the From (Many) side table that will have the offending values.
There were 209 resulting entries in the Product table with a blank ProductSubcategoryKey. These blank values were the reason a blank row was generated in the ProductSubcategory table. Here are a few rows from the result set. This may be valid for your model. However, often in a data warehouse environment, these keys would have a designated value pointing to an “Unknown” or “Unassigned” row.
Keep in mind that when there are multiple tables related to a table with a blank row, they may not all return results because they may not all have offending values.
Additional Considerations
There is one final item that should be pointed out. There may be tables with a generated blank row that were not generated due to a missing value, but were instead generated due to the concept of expanded tables. In the example AdventureWorks model above, the ProductCategory (One Side) also has a blank row in it because it is part of the ProductSubcategory expanded table which does have a blank row. However, just because it has a blank row doesn’t mean that ProductSubcategory (Many Side) has an RI issue. In fact, every ProductCategoryKey in ProductSubcategory is valid. You can see that ProductCategory shows up on line 12 of the Excel Workbook.
The complete explanation of expanded tables is outside the topic of this post, but essentially the expanded table of any table on the Many side of a relationship includes all the columns of the tables on the one side. In this example, the expanded Product table includes all the columns from the ProductSubcategory table and the ProductCategory table. Therefore, the blank row in ProductSubcategory is also causing the blank row to be generated in ProductCategory. If the missing values in ProductSubcategory are fixed and everything else stays the same, the blank row will no longer be generated in the ProductCategory table.
Final Thoughts
The steps to detect these issues would be very tedious and potentially error prone to execute every time you wanted to check for RI issues. But with the Tabular RI Analyzer, you can now refresh the result set in a few seconds to keep tabs on any RI issues in your model. I hope you find this valuable for your tabular models.
Download Tabular RI Analyzer