
If you’re involved in eliciting, modeling, analyzing, or consuming requirements for Business Intelligence (BI) projects, then this post is for you. This is one of my favorite techniques for scope definition.
What is a Data Flow Diagram?
The technical definition of this technique from the International Institute of Business Analysis (IIBA®) is: “Data flow diagrams show where data comes from, which activities process the data, and if the output results are stored or utilized by another activity or external entity.” – BABOK® v3.0
These types of diagrams simply depict the sources of data, what happens to the data, and where it goes to be used.
Data Flow Diagrams show:
- Source – where the data comes from
- Activities – what happens to the data
- Inputs/Outputs – what goes in, and what comes out
- Transformations – any changes that take place to the data
- Temporary or permanent repository locations – where the data lives
What Are the Elements of a Data Flow Diagram?
- External components:
- Entity – person, system, device
- Source – when the data comes from
- Sink – where the data goes
- Data Stores – data at rest
- Processes
- Manual, or
- Automated
- Data Flow – holds processes together
What Are the Levels of Abstraction?
There are multiple levels of abstraction possible using data flow diagrams. Level 0 is great for identifying scope, and the other levels are great for going into more detail about the movement and processes of data.
Level 0 – (aka Context Diagram) often used to depict scope
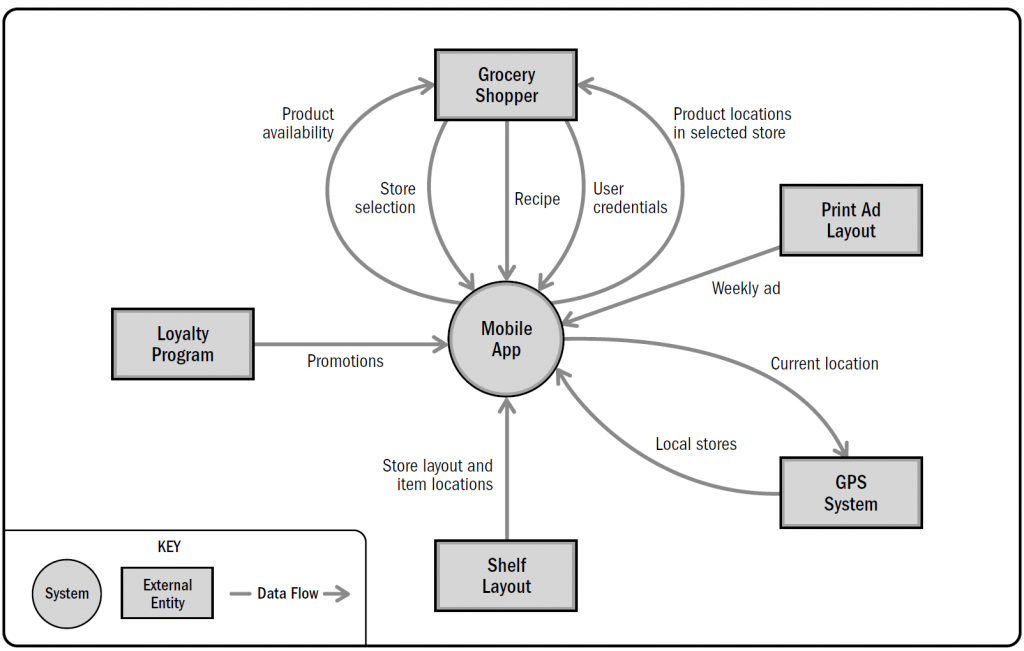
Example from: “Business Analysis for Practitioners, a Practice Guide”, published by PMI®
Levels 1+ – breaks down the major processes from a Level 0 diagram. These include the additional element of data stores.
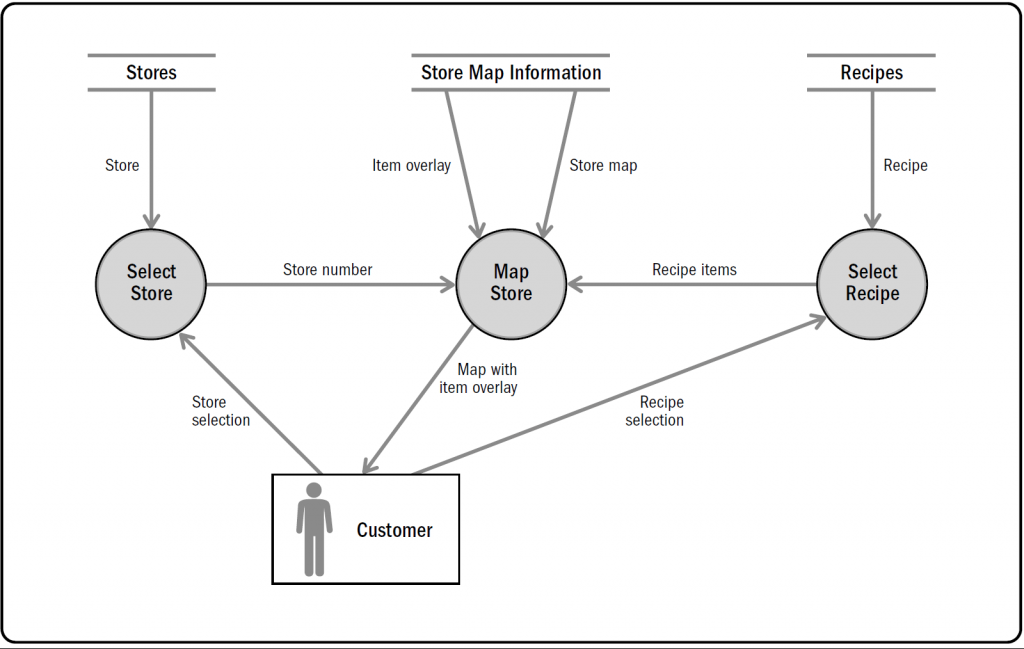
Example from: “Business Analysis for Practitioners, a Practice Guide”, published by PMI®
Pros
I know I am a little bit biased, but I love this modeling technique. It’s really easy to create, and it’s also easy for business people to understand. The notation set is very simple, and it requires little to no explanation. The model also really helps you understand what is happening in a system, and it is a great source of identifying gaps in your requirements.
Cons
Depending on how large your project is, this type of model could become too large and unwieldly fairly quickly. If it does get too large, it would be advisable to split it into smaller components that can be combined to depict a whole system.
Another con with this technique is that it does not show the details of the data – this is often included in a data dictionary, necessitating two different techniques being used.
One other con of this technique is that it doesn’t necessarily show the actors in the flow of data, it’s primarily a system-to-system look at where the data comes from and where it goes.
Conclusion
Data modeling is a great tool to help you discover your scope and identify gaps, and it is easily understood. However, it doesn’t dig into the details, so it must be supplemented with other models. This technique is especially useful in Business Intelligence projects, or any projects that are data heavy (which is pretty much all software development projects).
References:
“IIBA Home.” IIBA | International Institute of Business Analysis, www.iiba.org/.
“PMI.” PMI | Project Management Institute, www.pmi.org/.


Share on