
A painful memory that is burned into my developer-brain is a production support issue for a .NET web API that I wrote years ago. I worked for a large retailer at the time, and the bug was preventing electronic pricing signs from displaying the most up-to-date price for hundreds of products at over one thousand stores. As one could imagine, the business stakeholders weren’t thrilled with the defect and wanted it fixed immediately.
What was particularly frustrating to me was that I knew which lines of code were being executed, but I couldn’t figure-out why an exception was being thrown as the code “worked on my machine”. Being production code, it was compiled in release mode and no symbol files had been deployed – which meant I was getting minimal information back in the log files. Attaching to a remote debugging session in production wasn’t an option for a multitude of reasons. All I really wanted to know was what values were being passed into the function that was failing so I could reproduce the issue locally via a unit test. (See our app modernization solutions)
Fast-forward to today. Had my code been deployed as an Azure App Service using Application Insights, I could’ve quickly retrieved the variable information I wanted without any code changes or by adding lines of logging code that clutter-up the business logic. Using the Azure Snapshot Debugger, all I would’ve needed to do is view a snapshot of the exception and the variable values that were recorded. It sounds too good to be true…except it isn’t!
Viewing a Snapshot in Azure
Before digging into configuring the Azure Snapshot Debugger, let’s look at how it works when it’s enabled within Application Insights. The first place to look for exceptions in any Azure hosted app is in the Failures section of Application Insights. (Note: a proactive developer would set up Azure Monitor Alerts to receive notifications that exceptions were happening.)
In the screenshot below, a series of HTTP 500 errors are starting to stack up in the Failures blade of Application Insights for my demo application. Because I have the Azure Snapshot Debugger enabled for my demo application, it won’t be long before I uncover the source of the exception.
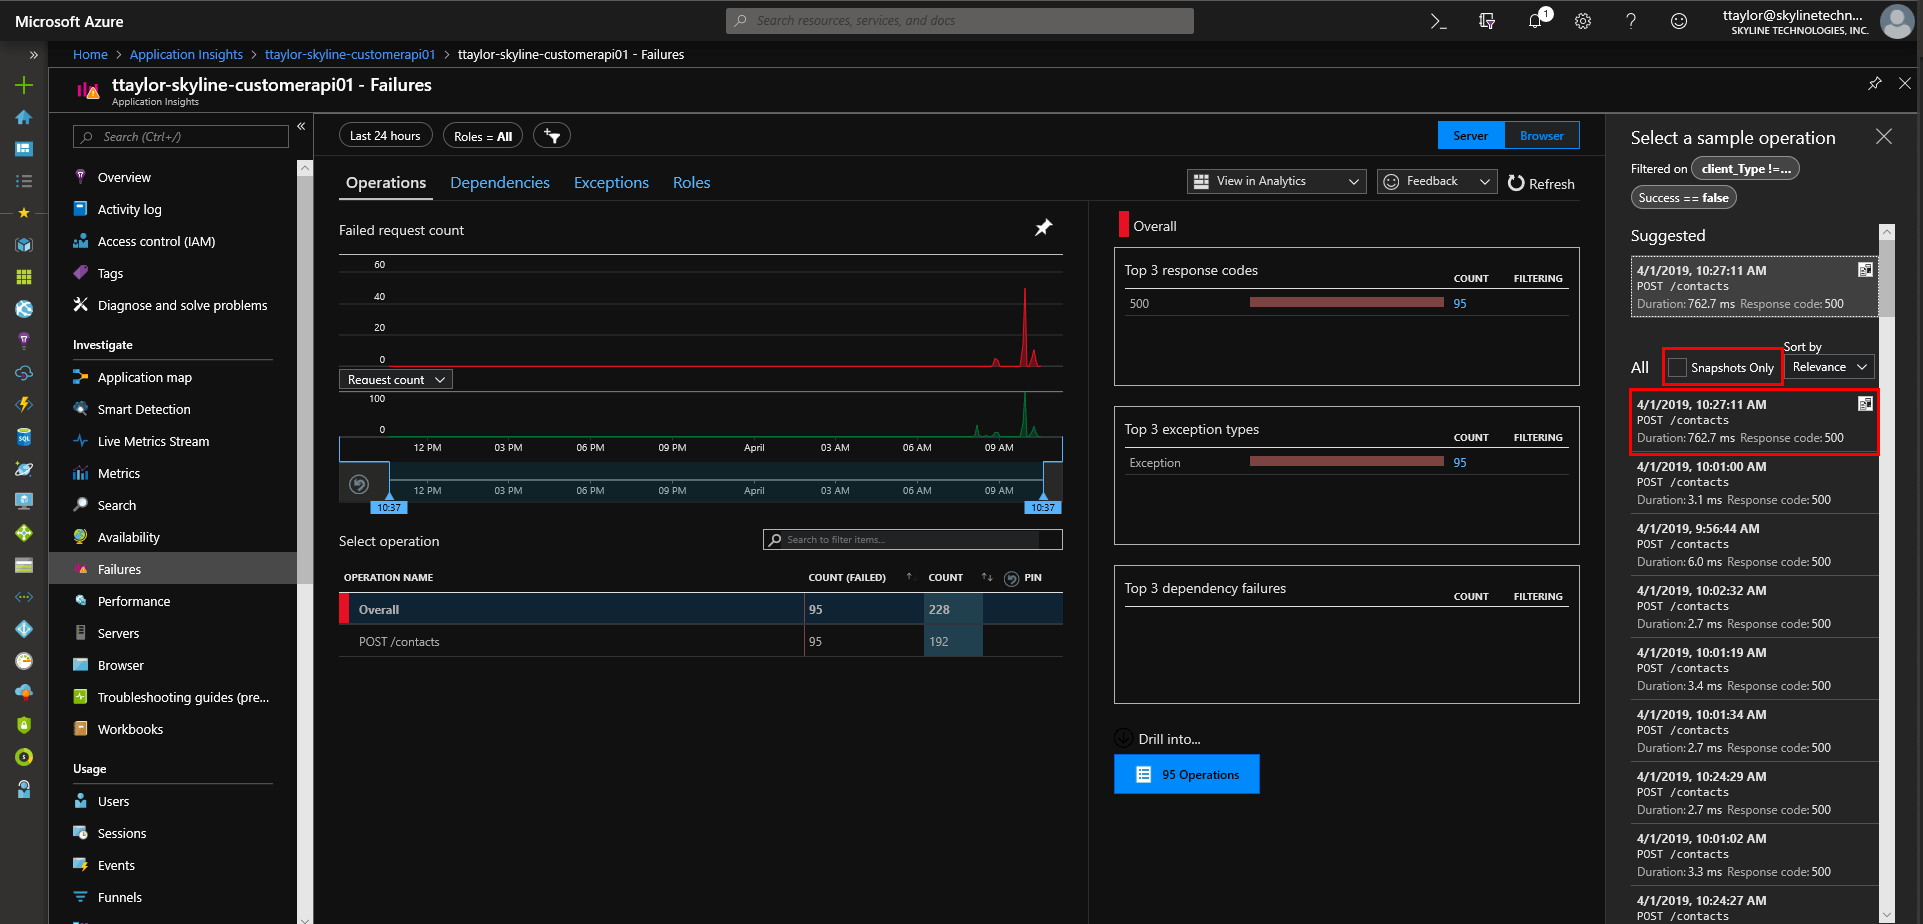
Clicking the blue Operations button below the Drill Into… heading opens the Select a sample operation blade on the right. In that blade is a Snapshots only checkbox for filtering the list to show only exceptions that have snapshots. A square icon appears next to exceptions that have snapshots.
Note: Exceptions take several minutes to find their way from the server (where the code is running) to Application Insights. The exceptions will likely be visible several minutes before the snapshots are available.
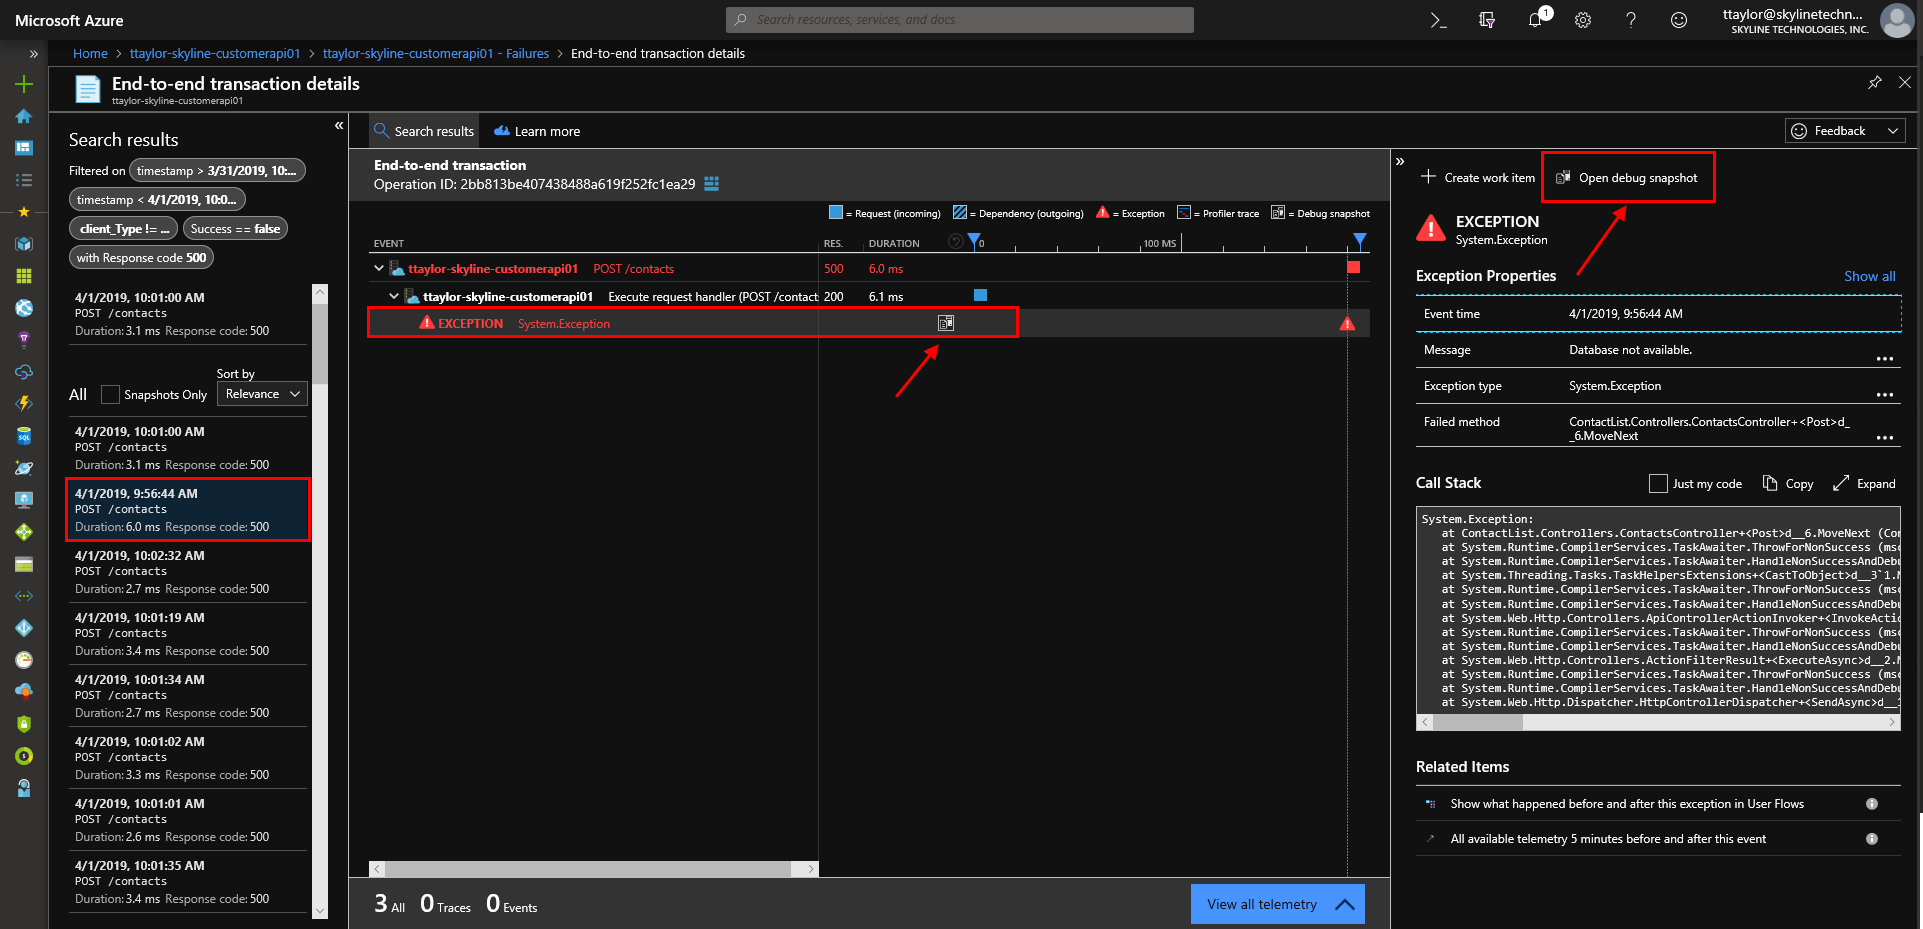
By double-clicking on one of the operations in the list, the End-to-end transaction blade is opened to reveal the exception details. Once again, you’ll see an icon next to the exception transaction that contains a snapshot. To view the snapshot, click the Open debug snapshot button in the Exception Details blade on the upper right.
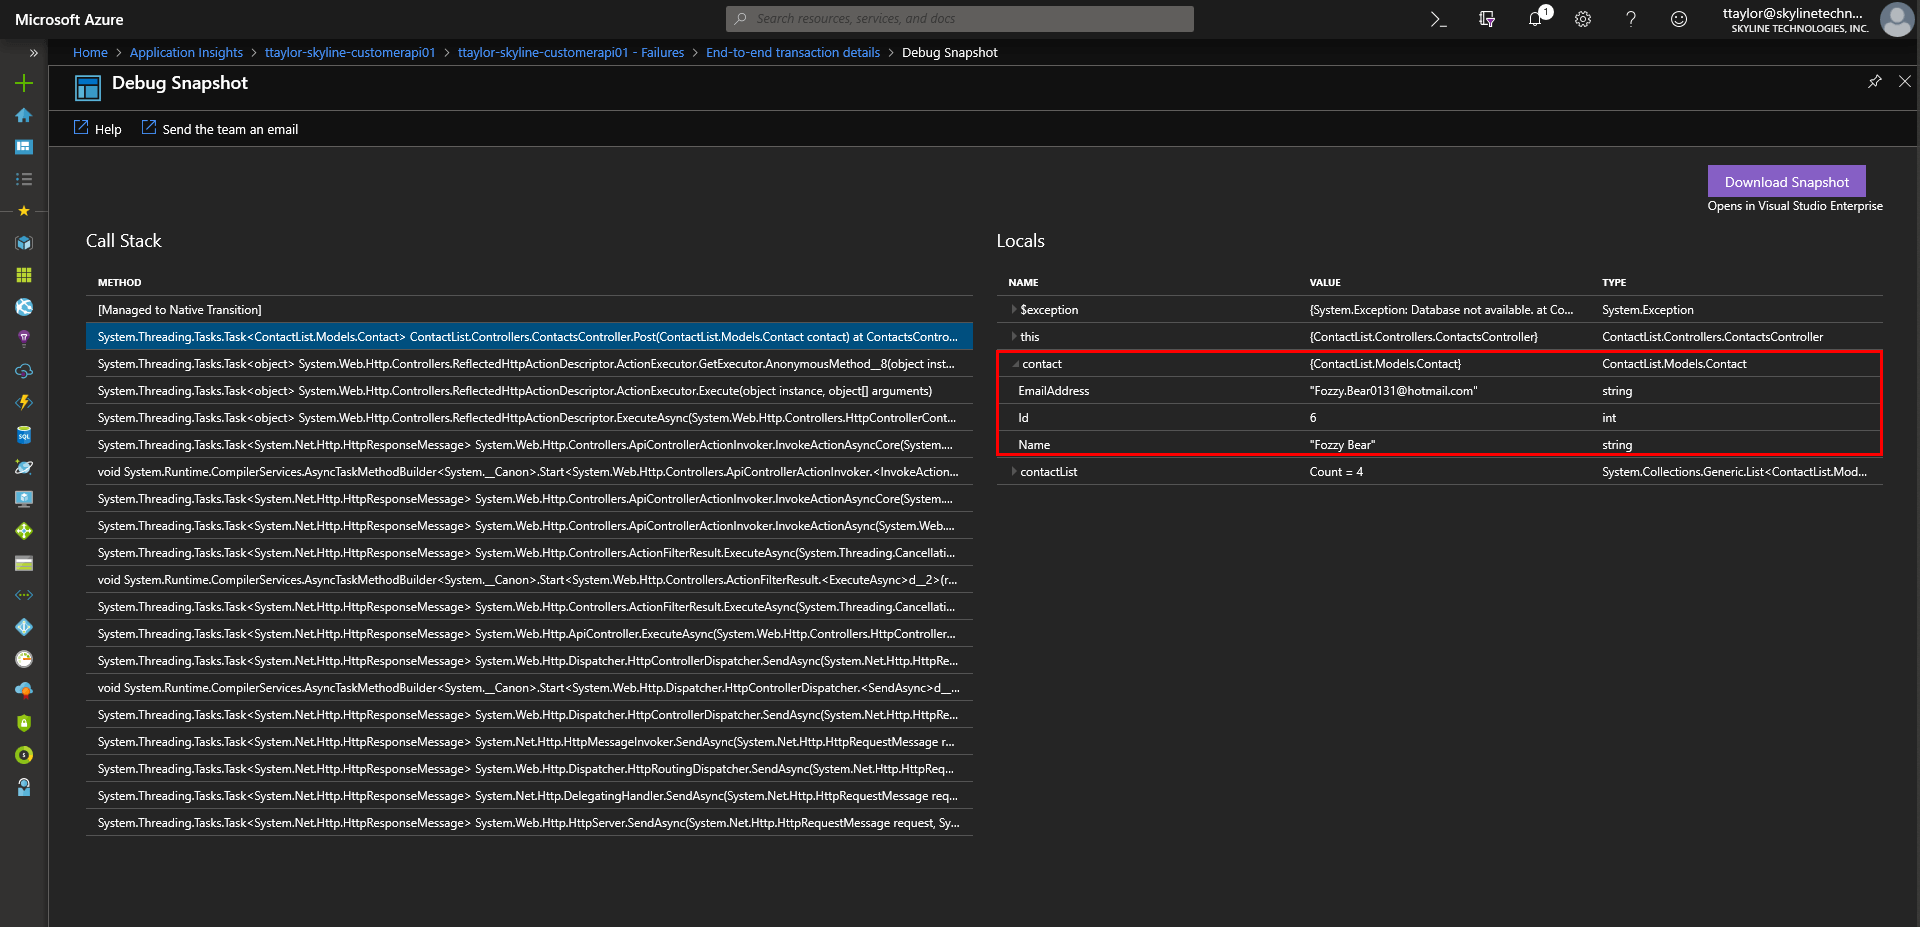
Once the debug snapshot opens, you’ll have access to the local variables under the Locals heading. As the narrator of Monty Python’s The Quest for the Holy Grail would say, “And there was much rejoicing!” If only I had this capability a few years ago.
Setting-Up Azure Snapshot Debugger
My first attempt at setting up the snapshot debugger for a client was more frustrating than I anticipated, so I’m hoping this blog post will help others avoid some of the issues I encountered. The documentation for the Azure Snapshot Debugger and related troubleshooting guide are good resources to start with.
Enable Snapshot Debugger in an App Service
The first mistake I made was that I had enabled Application Insights in my Visual Studio project, but I didn’t realize more steps had to be taken to enable snapshots.
One option is to add the NuGet package Microsoft.ApplicationInsights.SnapshotCollector to your website or web service project in Visual Studio. Once added, the NuGet package will add a new TelemetryProcessors section to your project’s ApplicationInsights.config file. Then you can set various settings by adding XML elements to the config. See Microsoft’s documentation for configuring snapshot collection. This is the recommended path if you have the ability to modify and deploy the source code because it offers the most control via the configuration settings.
The other option is to set the Application Insights Site Extensions toggle in Azure to enabled – which is the path I’ll follow for this blog for the sake of simplicity. You may choose this alternate approach for applications that are already in production and can’t be changed at the moment, but you still want snapshots enabled.
In the App Service blade for your web application, select the Application Insights menu item. Click the Turn on site extensions button.
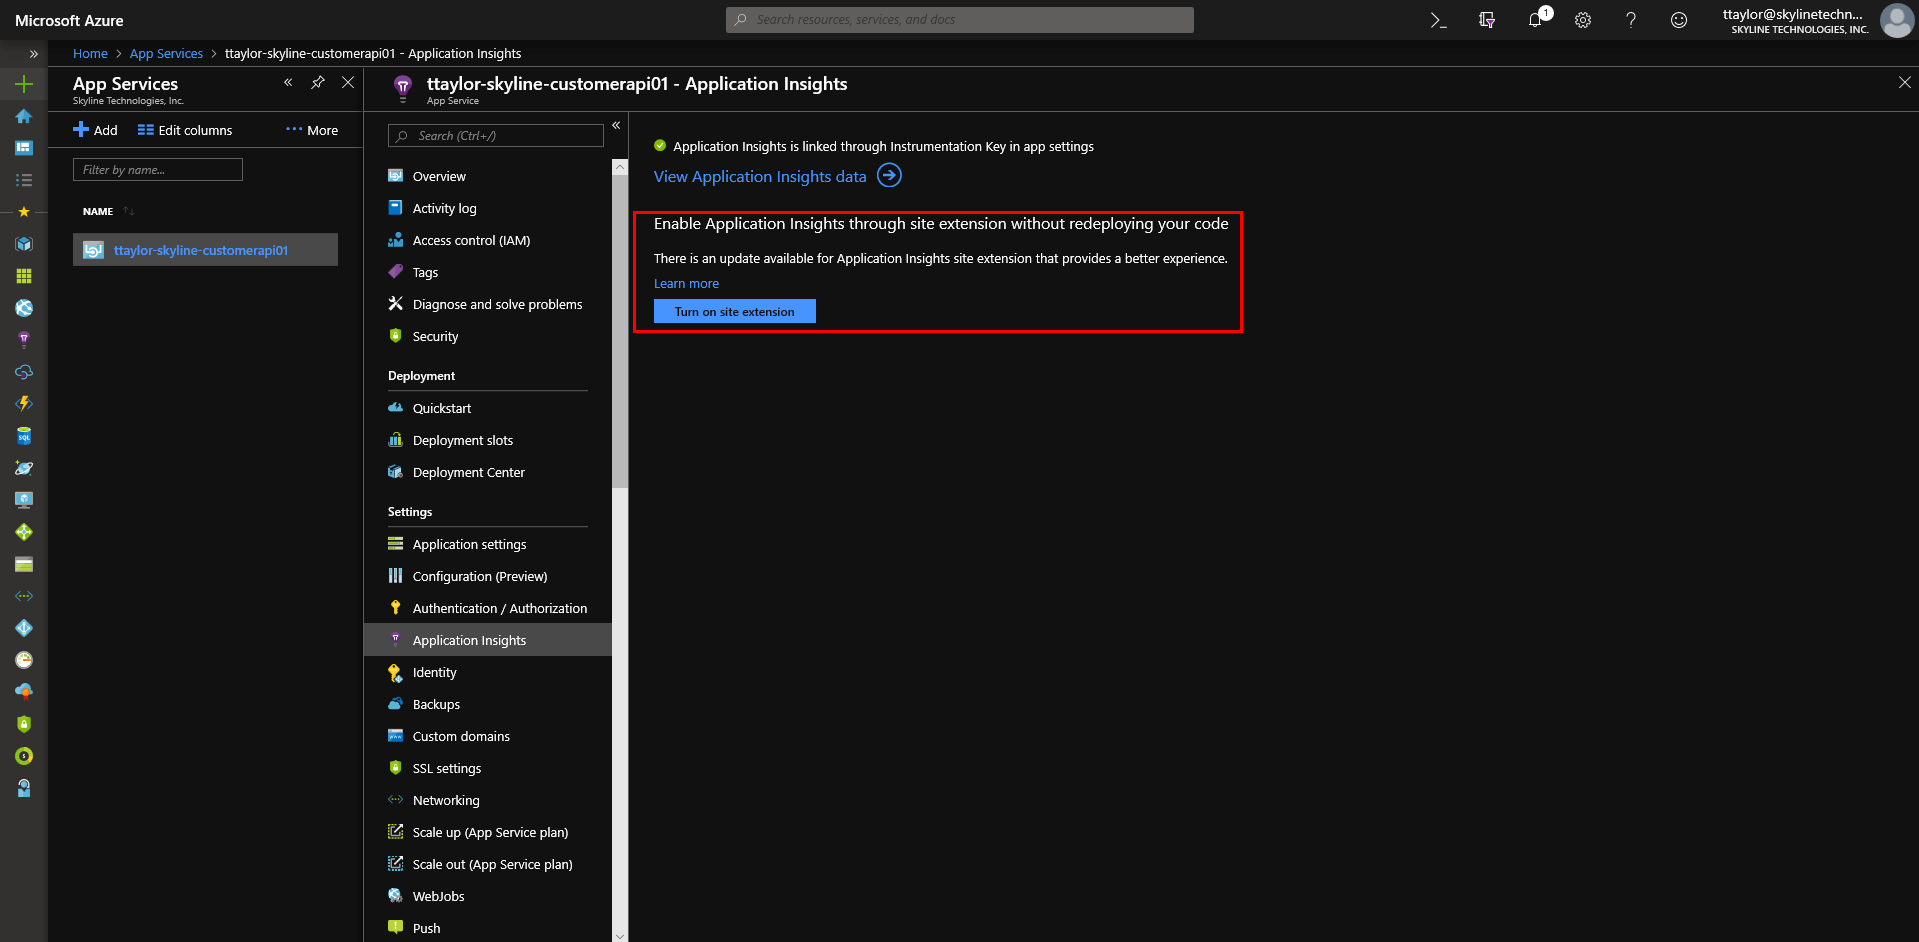
Toggling the feature to enabled will reveal additional settings. My demo app was written in .NET 4.6, so I’ll need to enable settings under the .NET tab.
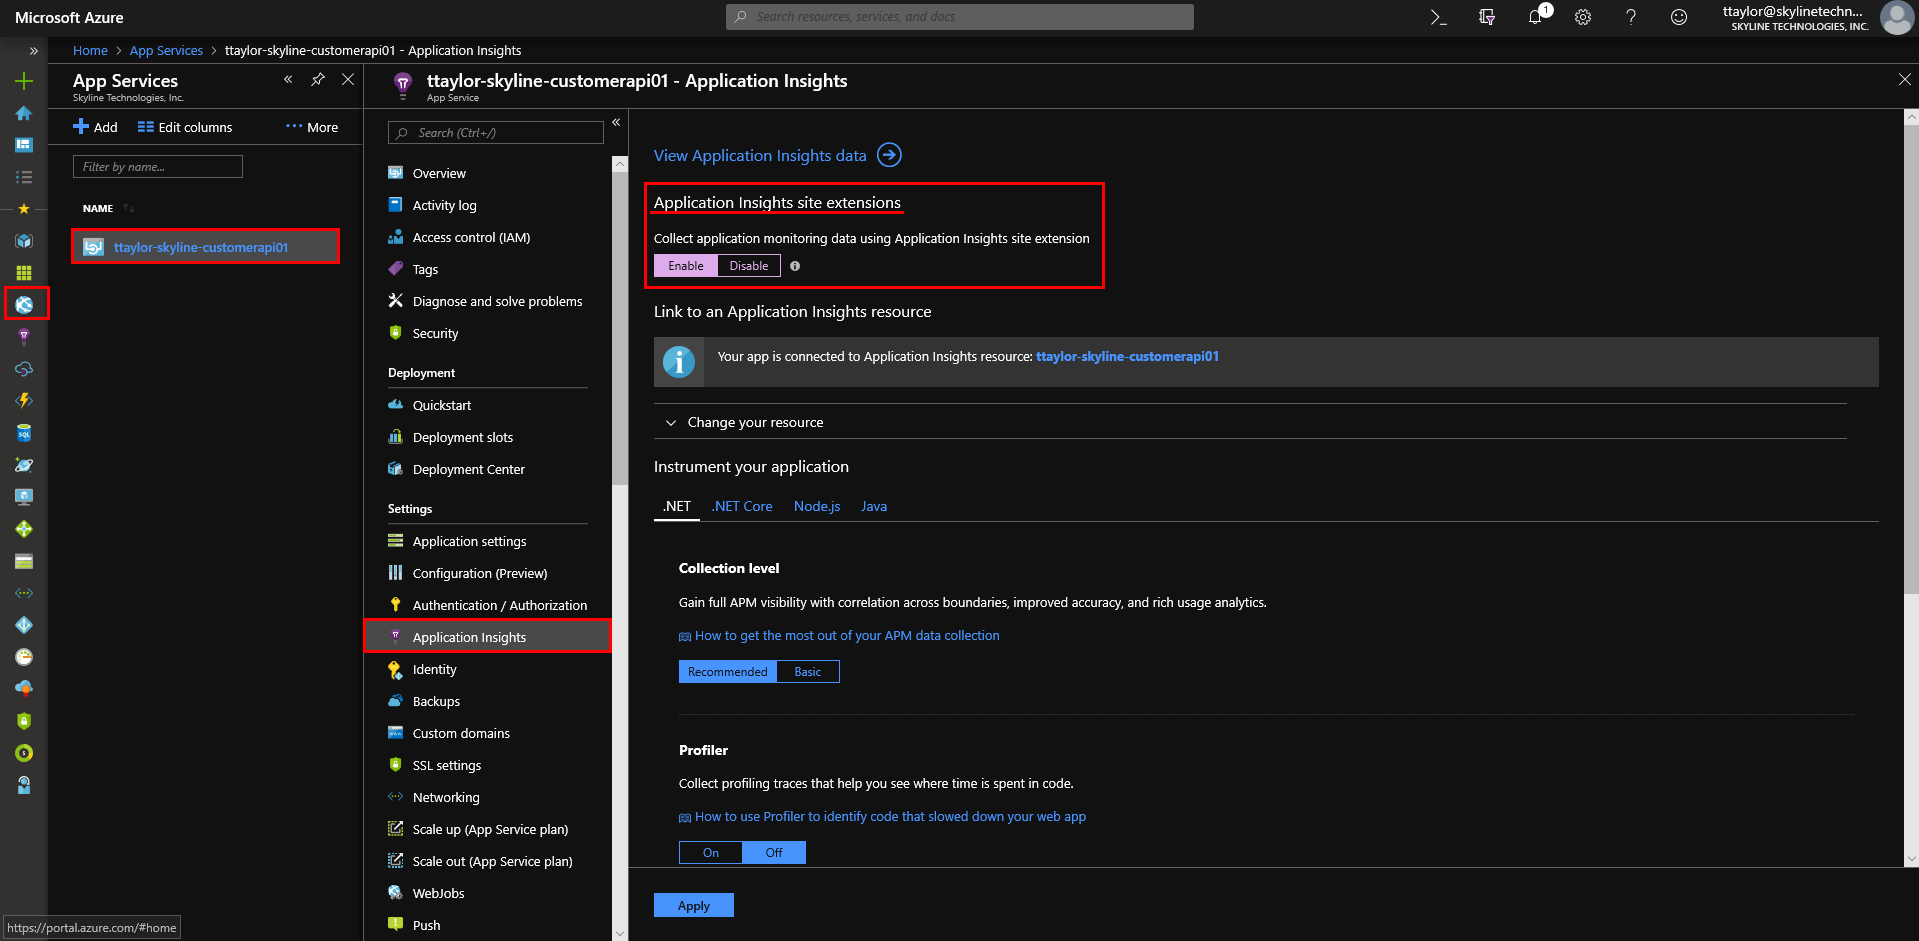
Once the Application Insights Site Extensions are enabled, turn on two toggles below the Snapshot Debugger section:
- Collect call stacks for your application when an exception is thrown -> On
- Show local variables for your application when an exception is thrown -> On
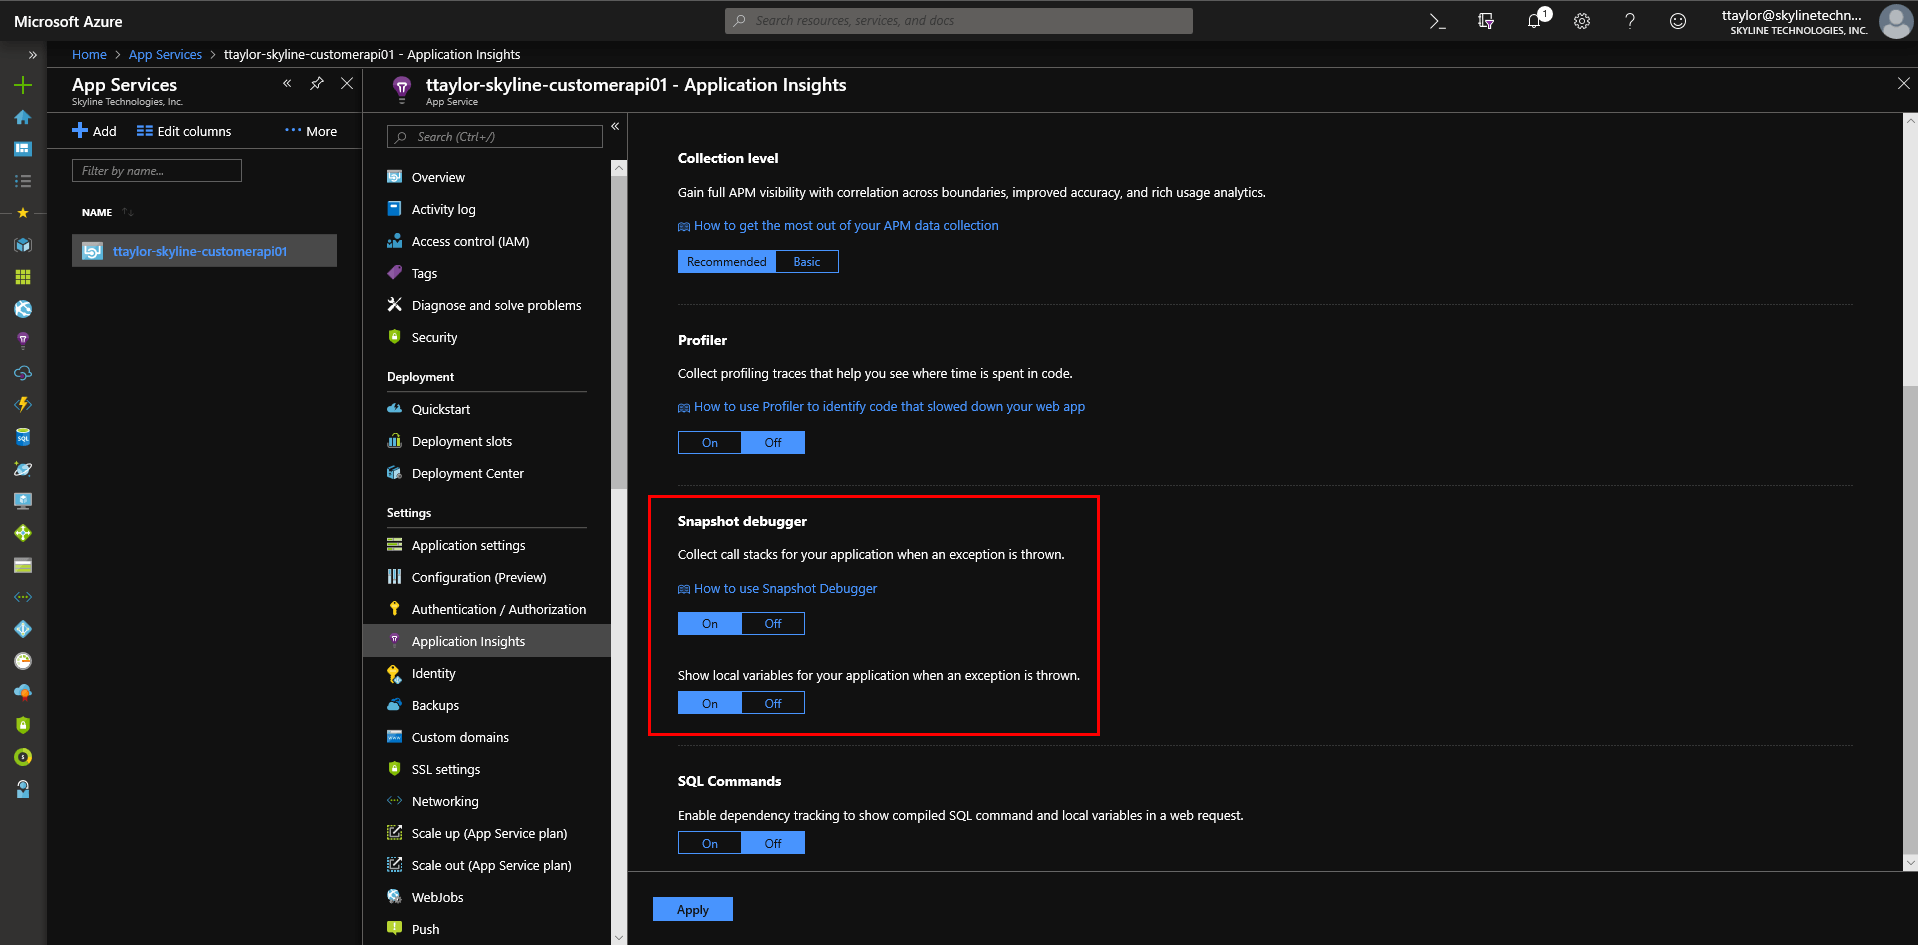
Click the Apply button when done to enable the changes in your App Service.
Ensure Symbol Files are Deployed
In order for the Azure Snapshot Debugger to work its magic, you must have the symbols files (*.PDB) even if you built your code in release mode.
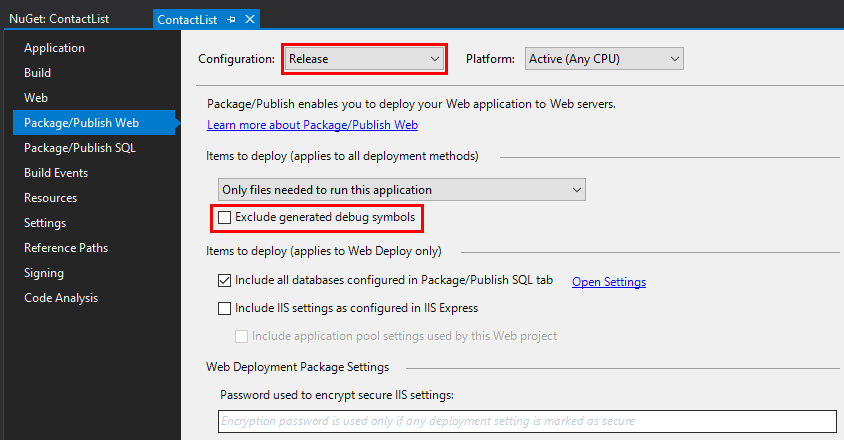
If you’re using Visual Studio’s Publish feature to deploy to a development environment, ensure that symbol files are being deployed. Right click on the project file in Visual Studio, select Properties (Alt+Enter), and click the Package/Publish Web menu item. Change the Configuration drop-down to Release and ensure the Exclude generated debug symbols checkbox is not checked.
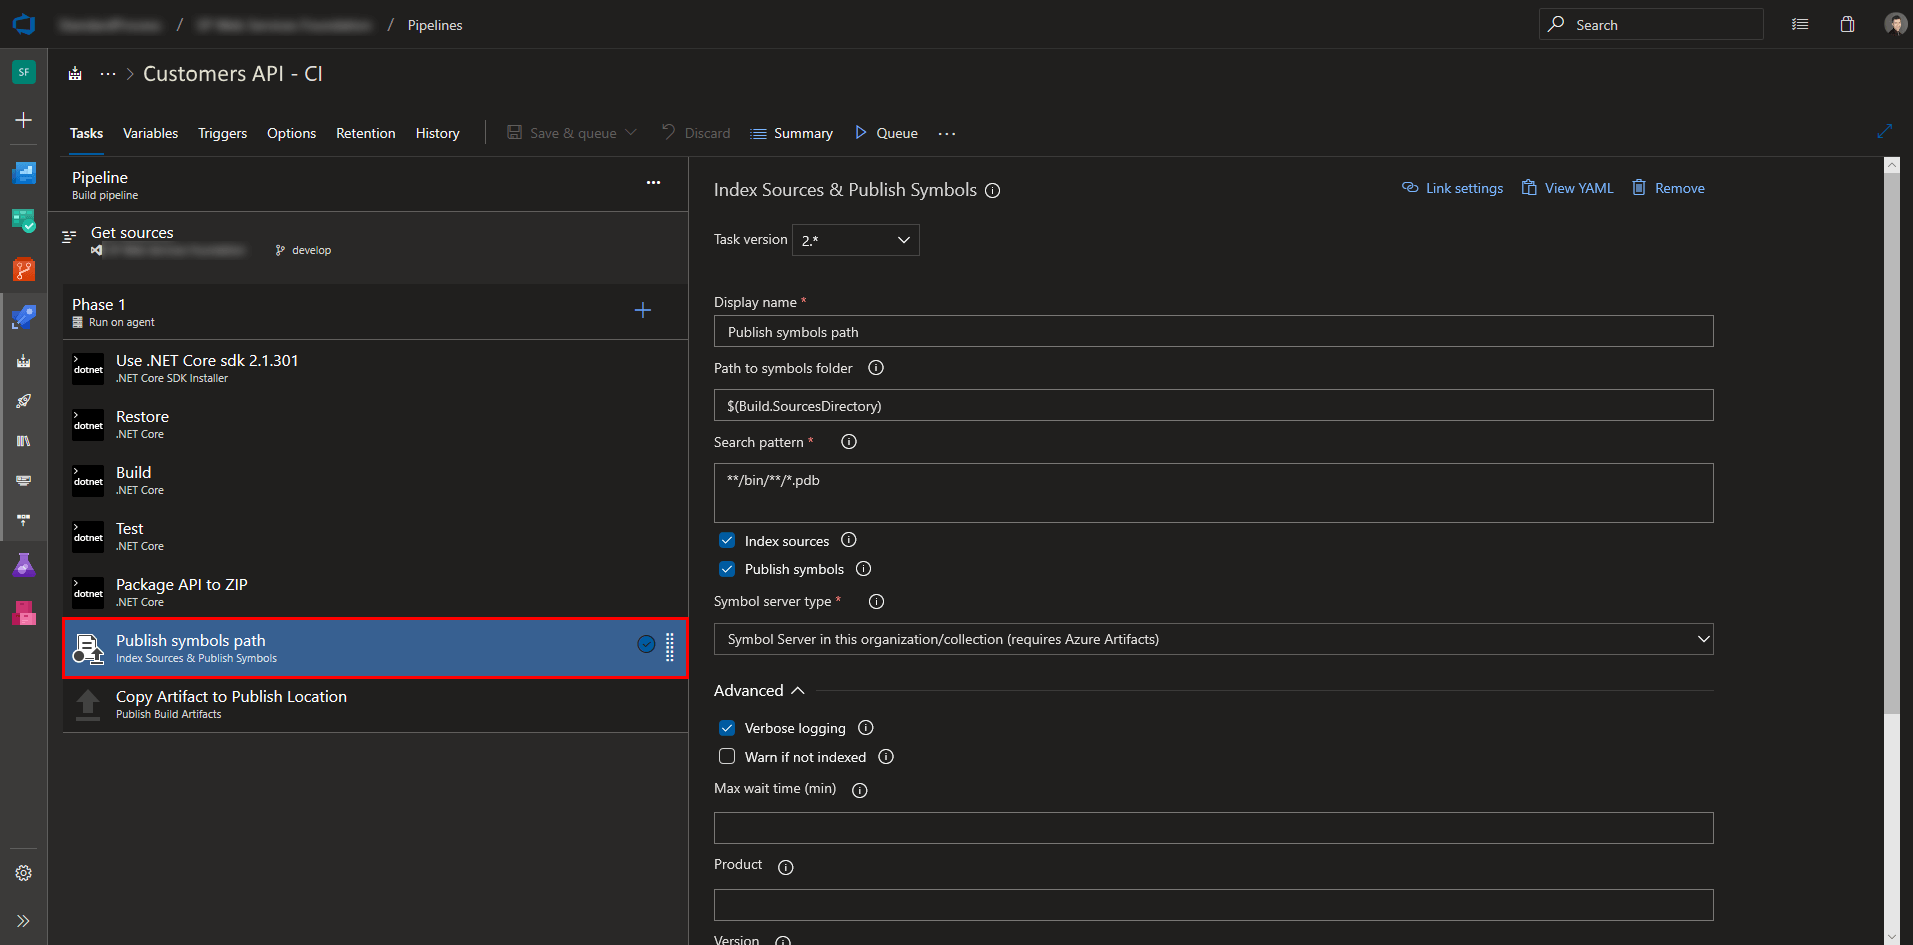
Hopefully, you’re taking advantage of Azure DevOps Pipelines to automate builds and releases of your code instead of directly publishing to the server. Publishing symbols files in a build pipeline is as simple as adding an Index Sources & Publish Symbols task to your build pipeline (which is typically added by default when you create a new build pipeline):
Granting Permission to Snapshots
And finally, you must grant permissions to the user accounts that should be allowed to view snapshots by adding the role of Application Insights Snapshot Debugger for each Application Insights instance. Snapshots will still be generated if you aren’t granted these permissions, but you won’t be able to view or download the snapshots.
WARNING! Azure Snapshots can reveal potentially sensitive information. Therefore, it is advisable to follow the principle of least privilege and only grant permissions to a user in production when there is a reason to do so.
To grant the permission to a user:
- Navigate to the Application Insights menu.
- Select the instance of Application Insights you would like to see snapshots for.
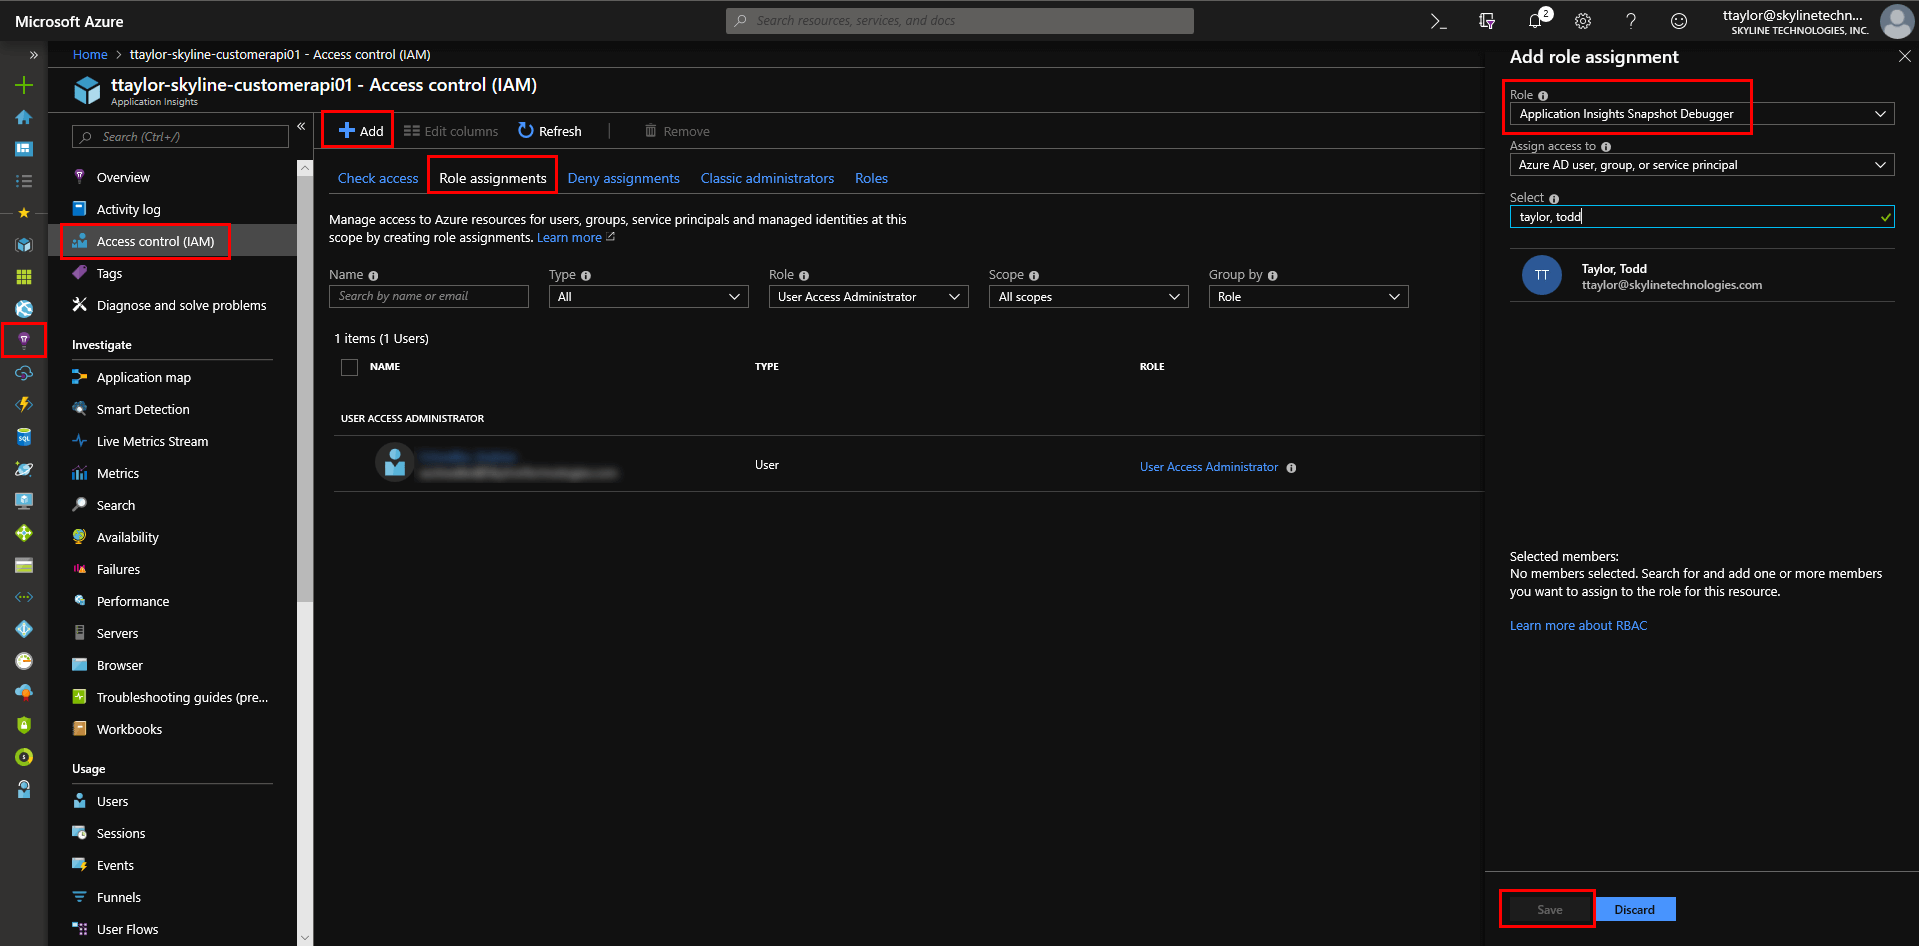
- Click the Access Control (IAM) menu item.
- Click the Role Assignments link menu.
- Click the +Add button.
- Select Add role assignment from the button drop-down.
- Under Role, select Application Insights Snapshot Debugger.
- Under Select, select the desired user account.
- Click the Save button at the bottom of the blade.
By default, an exception will need to be fired at least twice in order for a snapshot to be taken. Adjusting this threshold and other parameters isn’t possible through the Azure UI like it is when going the NuGet package route as described earlier.
BONUS: Debugging a Snapshot
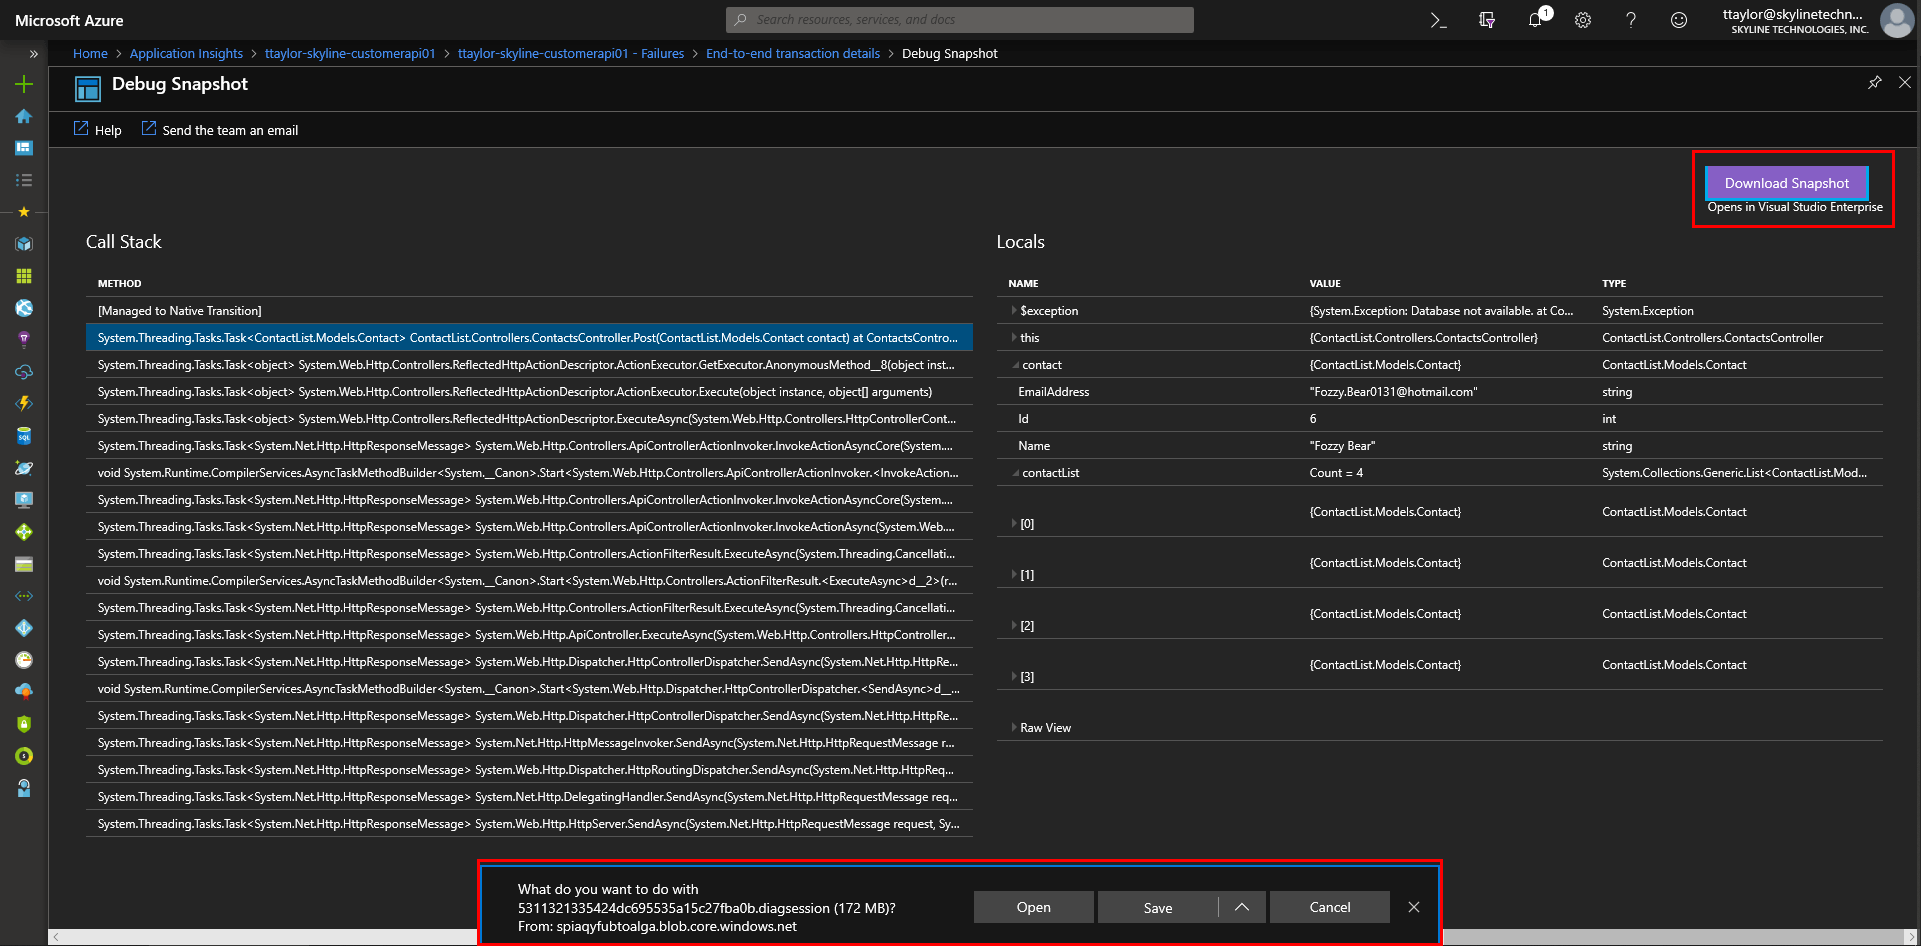
If you’re fortunate enough to have a Visual Studio Enterprise subscription, you can download the snapshot and replay the exception in Visual Studio. How cool is that?
Click the Download Snapshot button in the upper right-hand corner, and go get a cup of coffee while the snapshot file is processed and downloaded to your PC.
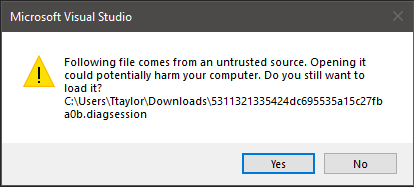
When you open the downloaded diagnostic session file, you’ll be prompted with a warning in Visual Studio because it doesn’t trust code that originated in Azure. You’d think Visual Studio would trust Azure, but I digress…
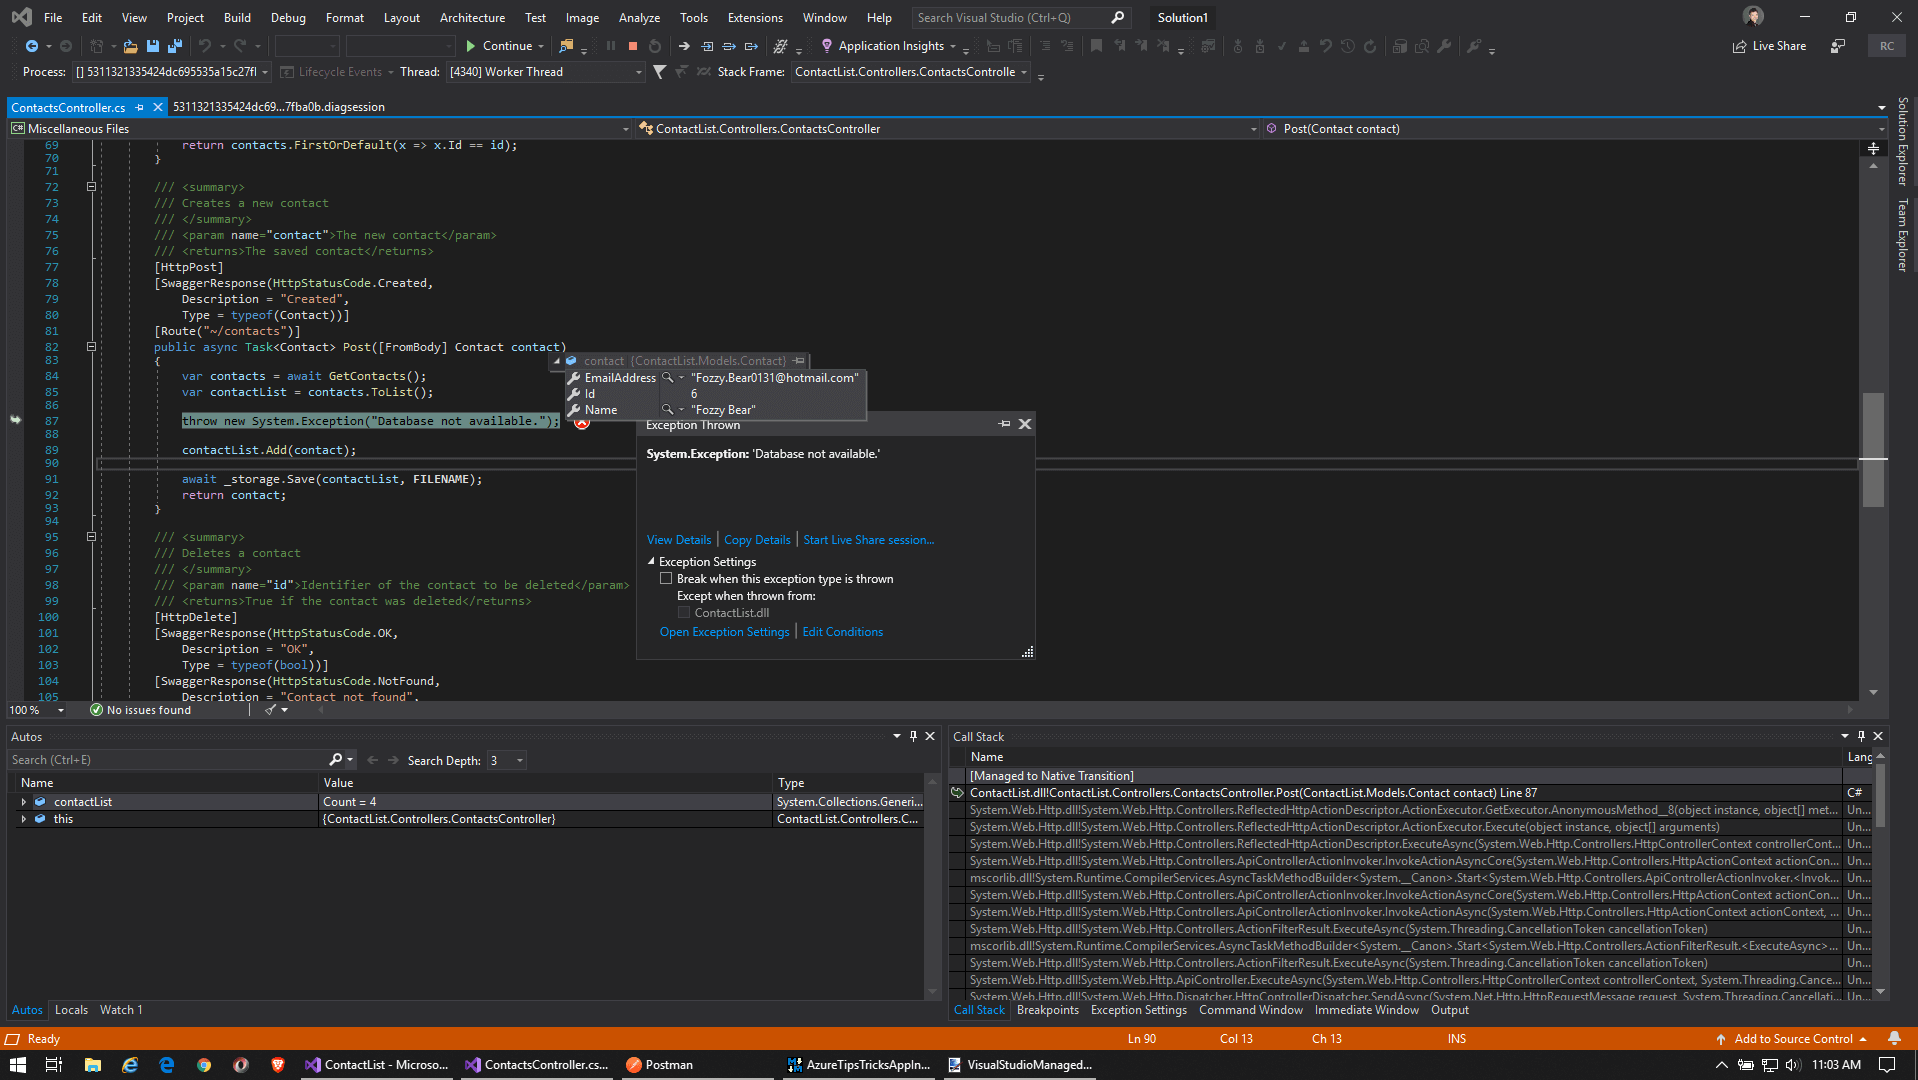
Once the Minidump File Summary opens, click the Debug with Managed Only link in the upper right-hand corner. This will cause Visual Studio to load all the symbols and throw the exception that occurred.
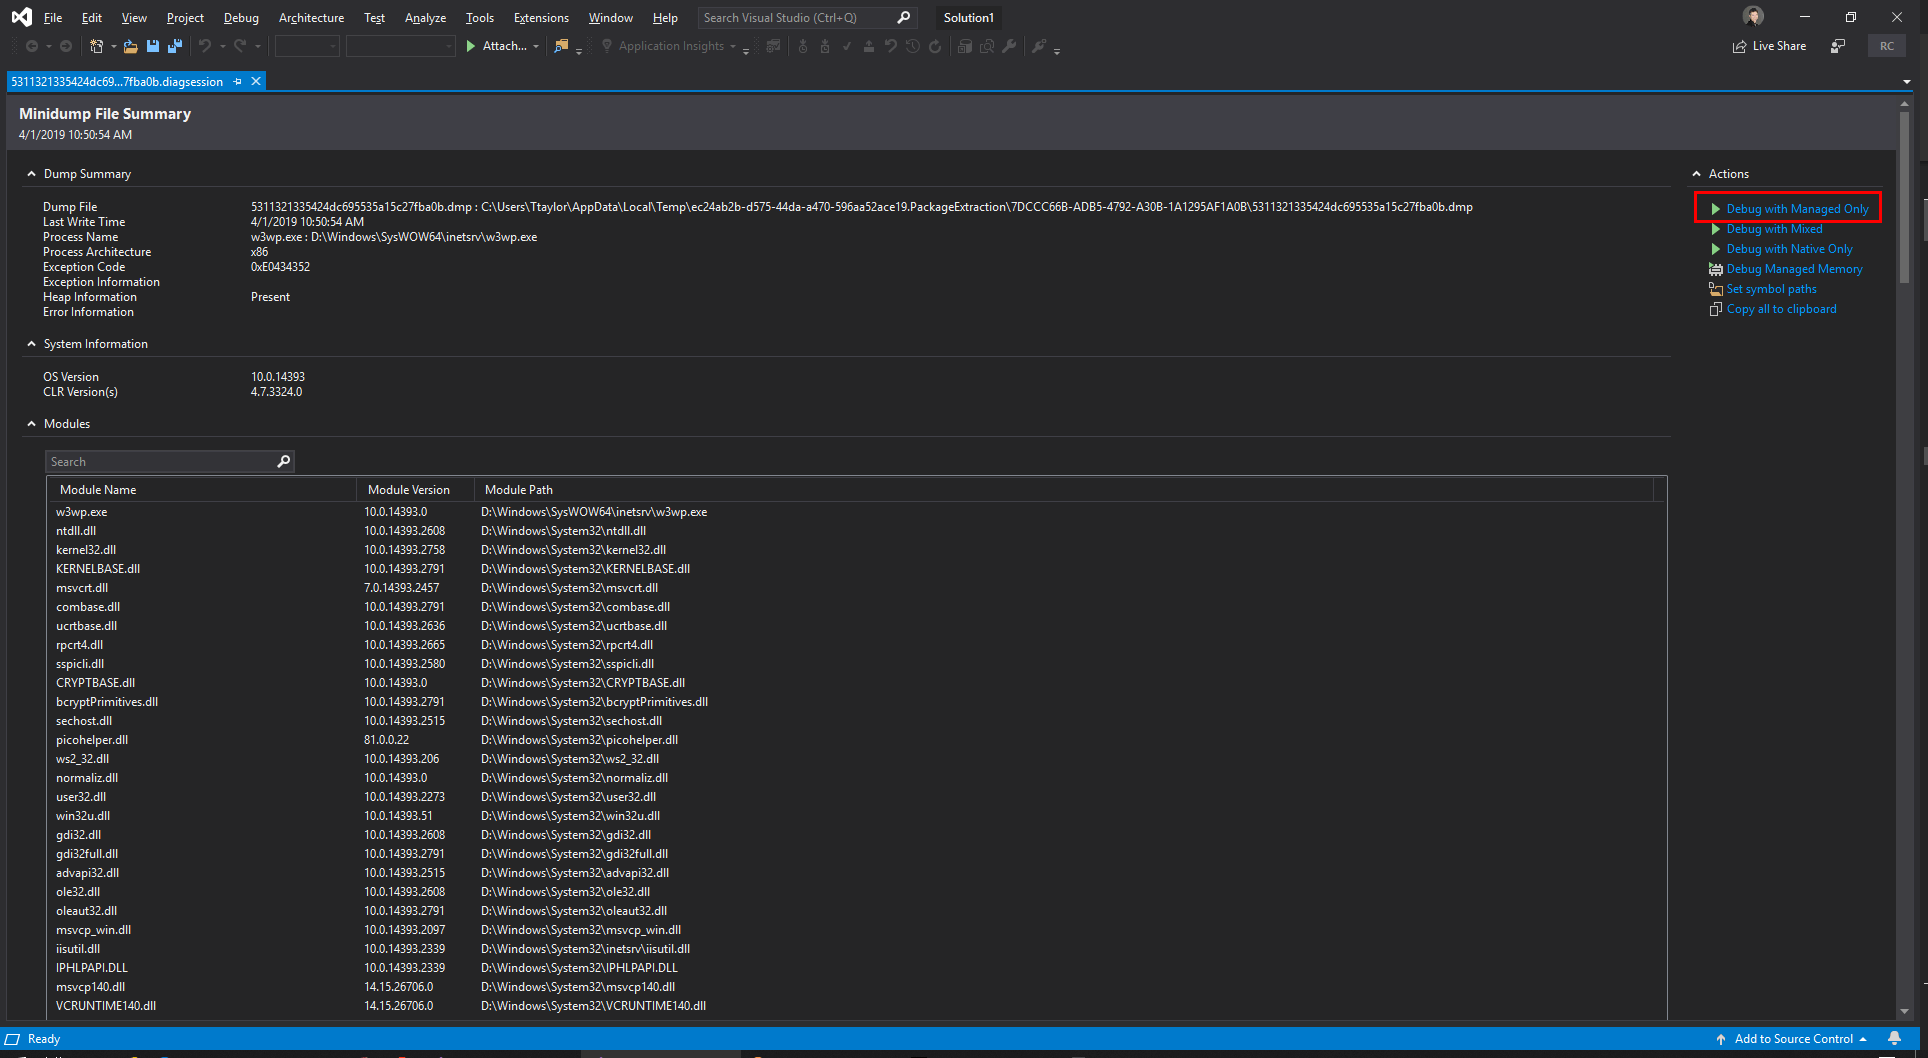
Almost like magic, the exact line of code that threw the original exception is highlighted. Just like in a normal debugging session, all the local variables and their values are available to you.
Go Forth and Enable Snapshot Debugger Everywhere
Thanks to the Azure Snapshot Debugger, supporting your apps in production just got a lot easier…but only if you enable it! It’s my opinion that this feature should be enabled for all services in production unless someone gives you a compelling reason not to. All it will take is a single production support incident for this functionality to redeem itself.


Share on